Data Science with Graphs – using knowledge graphs on the data before it reaches the ML phase
Graph usage in AI recently became quite evident with an increased number of research papers and some impressive examples among the industry . This article aims to answer the question: Are there ways to improve a project’s delivery by using graphs even before reaching GraphML?
Introduction
“We can do a lot more with data to make systems that appear intelligent before we reach for the ML pipeline” – Dr. Jim Webber, Chief Scientist at Neo4j [“Graphs for AI and ML” conference talk]
Graph usage in AI recently became quite evident with an increased number of research papers [figure 1] and some impressive examples among the industry of using Graph Neural Network-based architectures – like the AlphaFold 2 – turning the community’s attention to GraphML.
But perhaps the focus on this area solely overshadows the wider look at the applications of graphs in data science and some of the other advantages they can bring in general?
This article aims to answer the question: Are there ways to improve a project’s delivery by using graphs even before reaching GraphML?
Spoiler: yes – it can happen.
Knowledge graphs & graph databases
Starting with the basics, graphs are an abstract data type existing in various forms and shapes of implementation. Here is a couple of examples of graph entities for context:
- Graph algorithms (notably, the famous Dijkstra for shortest path-finding or PageRank, the original algorithm for Google’s search engine)
- Data Ontologies
- Tim Berner-Lee’s Semantic Web concept.
- GraphQL (graph-resembling API design)
- 3D mesh structures
For this article’s needs, I will focus on one particular type of a graph application: graph databases.
Graph databases are an implementation of graphs enhanced with efficient persistence of the data, a robust graph query language to ask for data and its relationships, and (depending on the DB vendor) an in-DB interactive graph data visualisation for easier data exploration and analysis.
Graph DBs introduce the terminology of “nodes” for data subjects/objects and “edges” for relationships between the data.
They can also extend the graph data structure itself with new features – in particular, Labelled Property Graph databases allow for giving labels to different data nodes (which can work as a types or even “tags” system), and add properties on both nodes and relationships.
Whilst one can model their database so that the relationships can have any meaning (or even no meaning at all and their purpose is to only connect the data, for example in a specific geometric pattern), a particularly interesting aspect of graph databases for data science purposes is that they support forming knowledge graphs – a graph data representation in which connections between the objects have a defined, semantic meaning allowing for enhanced reasoning while traversing through the graph.
Knowledge graphs require a “knowledge base” – a resource (or many resources combined) defining the semantics of the relationships between the objects in the graph. In a strict sense (commonly accepted as the “proper” way by the knowledge graphs community), such a knowledge base should be a formal description of each possible relationship in the domain – for example, an automotive industry-focused knowledge graph could be built on top of the schema.org’s taxonomy for a “vehicle” concept.
However, I will relax this strict knowledge base definition and consider any kind of a data model describing entities and relations between them as knowledge base too, as this will simplify introducing the forthcoming concepts while still being factual.In other words, for as long as your graph data reflect the meanings you defined through any kind of ontology, taxonomy, or a data model created specifically for your project, it will be considered a knowledge graph in this article.
There are two main graph DB technologies on the market and both, in principle, support creating knowledge graphs:
- RDFs (Resource Description Framework)
- LPGs (Labelled Property Graphs)
Whilst directly comparing the two technologies is out of the scope of this article, here is a useful article showing the main differences between them.
Having defined the common understanding of the knowledge graph concept in the context of the graph databases, let’s now proceed with exploring how they can be leveraged.
Graphs on the data science project – what’s more there apart from graphML?
To answer this question, I will make use of a great presentation by Dr. Victor Lee (VP of ML at Tigergraph – one of the LPG DB vendor companies) at the latest edition of the Connected Data World conference:
“Graph Algorithms & Graph Machine Learning: Making Sense of Today’s Choices”
During the talk, Dr. Lee breaks down a typical AI project into five main stages:
- Data Acquisition
- Data Cleansing
- Feature Extraction/Selection
- Model Training
- >Model Deployment
The first three stages form a great basis for the list of benefits that I would like to expand on based on personal findings from past graph projects – they are as follows:
- Intuitive data modeling.
- Improved data exploration & data discovery.
- Faster data model iterations & enhanced flexibility when changing the data model.
- Enhanced feature engineering/selection abilities, specifically:
- Easier querying of inter-connected (or indirectly connected) data than in the tabular data – improved features selection.
- Data-enriching graph transformations (above all: data paths creation, computed properties, in-graph data restructuring).
- Graph data science algorithms (depending on the DB vendor), including:
- Centrality & Community detection, Link prediction, graph similarity, and other useful algorithms adding extra information dimensions to your data.
Let’s now analyse these benefits one by one in context of the highlighted AI project stages from Dr. Lee’s presentation.
Graph benefits at different project stages
Stage 1: Data Acquisition
Benefit 1: Intuitive data modeling
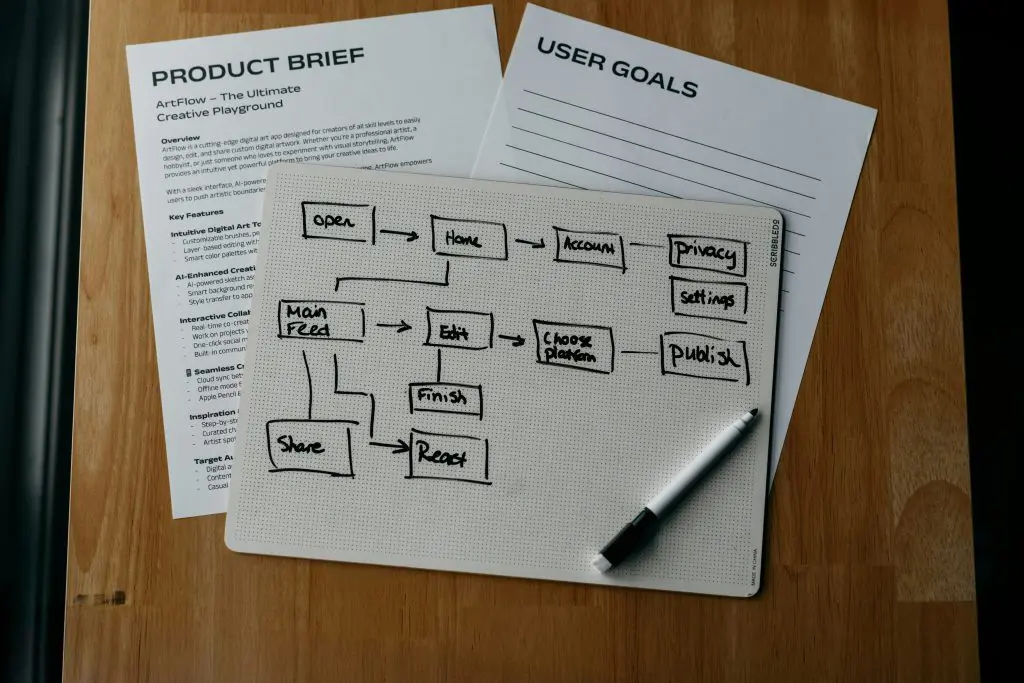
Graphs are simple in data modeling design (in other words, they are “whiteboard friendly”). They are basically mind maps, which make it easy to intuitively plan out the data stream and design the graph’s data model as there is no need to worry about any primary/foreign keys or structure rules that your data needs to follow.
Additionally, mind maps help explain the data modeling ideas to the business stakeholders of the project because they are usually more comprehensible than e.g. SQL relations mappings.
Extra benefit: Leverage open data standards via data ontologies (RDF DBs-specific feature)
In what can be described as perhaps the closest thing to transfer learning in the database world, RDF databases support building knowledge graphs on top of open-sourced data ontologies, i.e. publicly available knowledge graph data models of specific or general domains. This, in turn, can make the process of modeing your data model much faster. As described by one of the RDF DB vendors, Ontotext, in one of their articles:
“>Now you may be thinking that’s all well and good but creating a realistic map of all of these relationships sounds like a herculean task to begin with. You wouldn’t be wrong, except that you don’t have to build out a knowledge graph from scratch.”
“Graphs on the Ground Part I: The Power of Knowledge Graphs within the Financial Industry” article, section: “Taking Advantage of External Knowledge” [Source]
For example, if you need to map the financial data in your project, you could use the entirety or fragments of the Financial Industry Business Ontology as part of your own data model.
Note, some LPG DB vendors also provide ways to leverage external ontologies in LPGs via database extensions, for example Neo4j with their neosemantics plugin (example: FIBO in a neo4j LPG DB.
Stage 2: Data cleansing
Benefit 2: Improved data exploration & data discovery
Visualise, explore, and interact with your data more easily
One of the key benefits of bringing data into a graph format is that many graph databases provide interactive visualisation of your data. This means the developer/data scientist can often get more insights and “see” the data better than when it’s in a tabular format. This also means it’s easier to find discrepancies and bad data patterns in your data and fix them at this stage, rather than performing a post-mortem analysis of a badly performing ML model.
More efficient human-driven entity resolution
Oftentimes, data sources used on the project have a varying degree of quality with regards to duplicates. In situations where there are multiple data sources in your project – especially when the data is mutually inclusive, the problem can increase significantly – bringing data together results in conflicts or hidden duplicate entities lurking all over your data.
The below dataset from “what’s cooking” series of articles, creating a food metrics knowledge graph from a collection of recipes https://medium.com/neo4j/whats-cooking-part-5-dealing-with-duplicates-a6cdf525842a shows a glimpse of this on real-life data (and that’s from one data source only):
Therefore, being able to visualise the data allows for easier spot-checking of such phenomena compared to standard, tabular data. Additionally, in applicable scenarios, it allows more efficient cooperation with your data analysts or domain experts to identify and remove such cases without them knowing the technical details of your database (or query language).
Benefit 3: Easier data model iterations
Flexibility and ease of iterations
Graph databases are “schema-less” and they don’t require defining any structure/constraints/rules in advance when you start building/expanding your graph’s structure (a.k.a. “data model”).
Additionally, practically any problem can be shaped into a graph format, because graphs are conceptually easy -> they’re just a bunch of vertices and edges between them.
These two characteristics make graph DBs highly flexible and agile. And because they’re unconstrained by any design rules, they are highly iteration-friendly – changing a graph’s data model is much less hassle than e.g. de-normalising an SQL schema.
All this unlocks an extra degree of freedom on the project – you can focus on discovering your data “as it unfolds” rather than set up your data’s schema early (perhaps when you don’t really know the data yet) and then fight through any changes, or worse, stick to a schema that won’t let you answer project-critical questions.
[https://youtu.be/GekQqFZm7mA?t=640 the 10:40-13:14 fragment of this talk tells more about this.]
Stage 3: Feature Extraction/Selection
Benefit 4: Enhanced feature engineering/selection abilities via the graph query language
Ease of querying indirectly linked data
One of the main advantages of graphs is how “cheap” it is to traverse through them, compared to costly joins in relational databases.
The figure above presents how to perform a rather non-trivial ask for all people mentioned by any tweet related to the tweet our “main user” commented on. Such data requests require multiple “hops” through our data, yet, it was roughly 4 lines-long.
Here’s an example of how a similarly inter-connected data query can, in extreme cases, compare to data in a relational database:
If your project often relies on questions like: “what are the next Nth connections to element X and how do they change if I change X?” Or if you have to query paths between your data on a daily basis – storing data in a graph can be a big advantage due to how much time you will save when querying that data – both in terms of developing and maintaining the queries, as well as from the DB performance perspective.
Note: this section was used with Cypher – a graph query language implemented across a couple of LPG DBs including Neo4j, RedisGraph & Memgraph – as an example to compare against SQL. An RDF graph DB query (using the SPARQL query language) would look a bit different; here’s a comparison.
Data-enriching graph transformations
Convenient graph query languages capable of data transformations bring another advantage to the table – you can use them to perform calculations on your graph data and persist them.
Notable examples of enhancing your data:
- Identify and create new paths /data relationships between given data points.
- Generate computed properties based on close/distant relationships
- Restructure/re-shape your data directly in-graph.
This very benefit of graph databases is leveraged by trase.finance – a graph DB-based platform for tracking down, monitoring, and calculating the biggest contributors to deforestation in the Brazilian and Indonesian tropical forests regions.
As shown in the figure below, trase.finance uses data-enriching graph transformations (specifically, computed properties generation) to dynamically propagate the deforestation risk and deforestation volume parameters across the company’s legal hierarchy and shareholding chains.
Benefit 5: Graph data science
Finally, as the last piece of the superpowers coming with data stored in graph databases, let’s briefly mention the various useful graph algorithms, often directly built-into the graph DBs. As this is the area where what is “just” data science and what is graphML is the most blurry, I will give only a high-level overview of it here so that it can be explored more along with other ML solutions in a future article dedicated to GraphML.
This aspect tends to differ the most between RDFs & LPGs and, within them, their various DB vendors and implementations, but the main concept relies on the same – leverage how the data is structured to perform an algorithm on it and come up with meaningful analytics.
A common scenario for graph DBs, especially seen across Labelled Property Graphs’ DB vendors, is to contain a separate “add-on” library that implements a set of algorithms “out of the box”.
One example of that is the TigerGraph database with its Graph Data Science Library:
Another example is Neo4j DB with its GDS library, here’s a helpful infographic of their sample graph algorithms suite:
Turning to the RDF world, an extra strength of theirs is that apart from potential built-in graph algorithms RDF DB vendors, thanks to the integration with the ontologies at the core level, implement a so-called reasoning engine which allows the DB engine to draw inferences from the connections.
For example, imagine having a knowledge graph for an automotive industry business use case. Due to the reasoning, you could query the data for anything that’s a vehicle and the results would give us exactly that, even if the graph didn’t have any kind of “is type of vehicle” connection for our nodes. This is because, provided the data is correctly built on ontologies and thus the connections have true semantics, the DB engine can infer that e.g. any motorcycles are also a vehicle because the motorcycle entity is defined via an ontology (such as this one: https://schema.org/Motorcycle). Therefore, you could consider this feature of RDF DBs as a form of machine learning since, as long as you keep the coherent semantics of connections between the data in the data model, the DB engine has an “understanding” of what are the objects in the database.
In terms of graph algorithms library examples similar to the highlighted LPG vendors, it appears less prominently than in the LPGs – for example, Ontotext, one of the leading RDF DB vendors provide a handful of graph analytics features via their plugins. The most similar example of a DB vendor offering a comparable library of out-of-the-box graph algorithms is Stardog with their Graph Algorithms module.
While the showcased graph analytics can be considered largely representing unsupervised ML, there are examples of Supervised ML in both graph DB types as well.
Stardog DB expands the idea of reasoning and allows creating classification, regression, and similarity models via using the semantically-defined objects in the graph as labels. More details can be found in their documentation.
For LPGs, Neo4j’s GDS library recently began supporting supervised ML algorithms too – as of writing this article, these are: logistic regression and random forest methods, along with two built-in ML pipelines: node classification and link prediction, which rely on the methods mentioned.
Finally, some DB vendors also provide interfaces for users to make their own custom graph algorithms and models if needed. For example, Memgraph DB exposes a Python-expandable query module object along with docs providing explanations on how to extend it [source]
It is likely, for certain use cases – e.g. community-detection or for certain constrained path-finding business requirements – that the out-of-the-box graph algorithms could be sufficient enough for any AI needs on a project and become the sole reason to try using graph databases.
Conclusions and what’s next
The above mentioned five benefits of using graphs in a data science project answer the original question posed in the introduction section – it is possible to improve the project’s delivery by using graphs without even reaching the graphML stage.
Putting the data in your project into a knowledge graph structure through one of the graph databases can bring several advantages to the data workflow and in certain cases, due to the appearing graph data science features, reduce the need for implementing the commonly perceived graphML approach altogether.
The next article in the series will look into the ways of integrating the actual ML pipelines with graphs (with or without prior usage of graph databases) as well as review potential data challenges coming with using them in the project. Stay tuned for that!
Further learning resources
- Introduction to Graph Theory: A Computer Science Perspective – Useful introduction (or a refresher) to the topic of graphs as an abstract data type.
- 6 – Graph Data Science 1 6 What’s New – great presentation of both the general AI in graphs overview from a graph DB vendor’s perspective as well as an overview of the features in Neo4j’s graph data science library (note there has been a 2.0 version of the library recently released, more information here.
- Dr. Victor Lee – Graph Algorithms & Graph Machine Learning: Making Sense of Today’s Choices | CDW21 – an overview of the AI landscape in graphs.
- https://levelup.gitconnected.com/knowledge-graph-app-in-15min-c76b94bb53b3 – an interesting, graph DB-agnostic example of how to quickly prototype a knowledge graph app to test graph’s usefulness on the project without committing to either of the two main graph DB technologies.