Unlock the Full Potential of AI
We are applied AI experts. Through guidance, strategy,
and implementation, we support you every step of the way
to unlock the full potential of AI for your business.
Your Trusted AI Experts
Providing guidance and delivering tailored AI solutions that give you a competitive advantage.

commercial AI projects
completed
world-class
AI experts
years
of AI expertise
Join our established list of long-term satisfied clients, including global brands, tech enterprises, ambitious scaleups and startups. Whether you’re rapidly scaling with AI or making it the core of your business, partner with us to achieve exceptional results.


Official Partners
We’re proud to be official partners of AI leaders, giving us and our clients access to cutting-edge, state-of-the-art technologies and ensuring that we remain at the forefront of applied AI.


Explore Our AI Technology Expertise
Harness our expertise in advanced AI technologies—LLMs, RAG, MLOps, computer vision, edge solutions, and predictive analytics.
We deliver scalable, production-ready solutions to optimize workflows, enhance decisions, and drive real results.
LLMs & RAG

Implement LLMs and real-time data retrieval systems to develop AI agents, co-pilots, and decision-support tools
with precise, context-aware functionality.
MLOps

Automate ML workflows,
from model training to CI/CD pipelines and monitoring,
to ensure scalable and resilient AI systems in production.
Computer Vision

Utilize image recognition,
3D modeling, and defect detection to drive innovation
in autonomous systems and precision manufacturing.
Edge Solutions

Integrate edge AI for low-latency processing in IoT networks, embedded systems, and remote monitoring under resource constraints.
Predictive Analytics

Apply advanced analytics
for predictive maintenance, anomaly detection, and demand forecasting to
optimize system performance and business outcomes.
Solutions Tailored To Your Needs
Whether you’re responsible for product development or innovation, seeking improvements in your business operations,
aiming to implement and operate AI more efficiently, or looking for a team of AI experts, we are here to help.
Showcasing Our State-of-the-Practice
-

project
Smoother Onboarding and Collaboration with GenAI Monitor
In our project, GenAI Monitor provides a shared, transparent repository for all agentic interactions and experiments. This eliminates knowledge silos, accelerates onboarding,…
-

project
Streamlined Observability for GenAI Workflows
In our project, the observability system allows us to monitor full agentic workflows, link experiments to execution providers, and inspect both high-level sequences and…
-

project
Efficient Caching for Generative AI Workflows
The caching system significantly reduces costs by eliminating redundant LLM calls, especially in reasoning-heavy workflows. It enables fast, low-overhead replay of agentic sequences and…
-

case-study
30x Faster Inference with Custom LLM SDK – Bringing GenAI to the Edge
This initiative validated that generative AI can run efficiently on edge devices, delivering cloud-level performance while improving speed, cost, and privacy.…
-


case-study
Saving 90% of Time with an AI-Driven Assistant for Real-Time Project Status Tracking
By automating project updates, we helped PMs and non-technical stakeholders stay informed without searching through multiple platforms.
-

case-study
5x Boost in In-Silico Drug Discovery with a Multimodal LLM
The new LLM allows the client’s research team to explore molecular properties and relationships more effectively.
What Our Clients Say About Us
Working With AI Leaders
Our close partnerships with industry leaders keep us at the forefront of AI innovation. These relationships ensure we bring the latest advancements and deep expertise to every project, empowering you with state-of-the-art solutions.
Our Insights and Resources
Explore in-depth insights on LLMs, RAG, MLOps, computer vision, edge solutions, predictive analytics, and beyond—delivering value-packed perspectives for both business leaders and developers.
-

Ebook
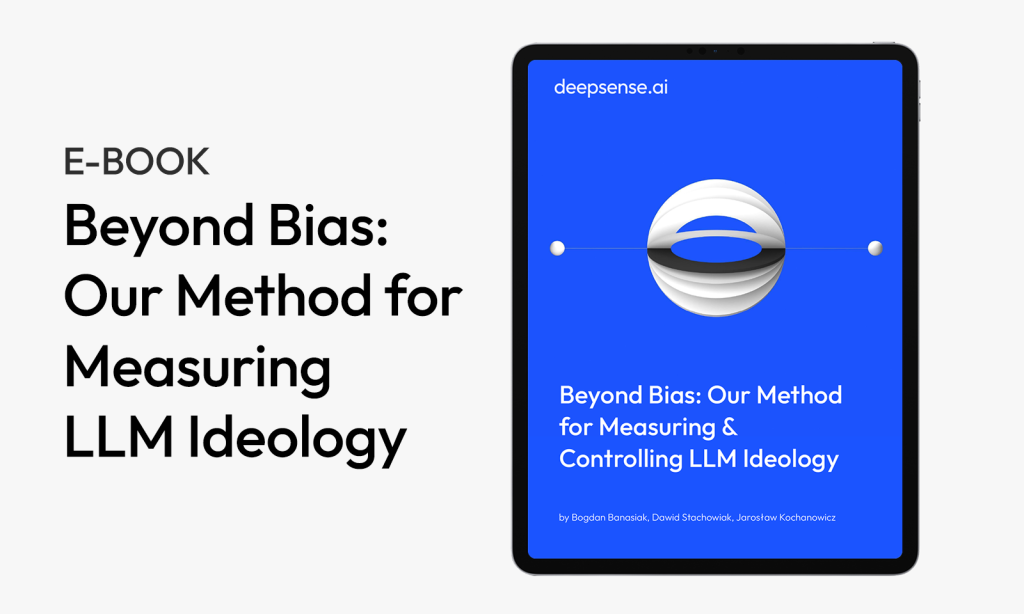
Beyond Bias: Measuring & Controlling LLM Ideology
-

Cookbook
Scaling RAG Ingestion with Ragbits, Ray and Qdrant
-

R&D Hub
GenAI Monitor Framework
-

Blog post
LLM Inference Optimization: How to Speed Up, Cut Costs, and Scale AI Models
-

Blog post
Browser AI Automation: Can LLMs Really Handle the Mundane? From Lunch Orders to Complex Workflows
-

Blog post
Region of Interest Pooling and Region of Interest Align explained


With experience across industries,
we deliver impactful projects in these key sectors.


