
The new version of the ggplot2 package (v 2.0.0) will be available on CRAN in a few days. It has a very nice mechanism for adding new geoms and stats (more about it here).
Table of contents
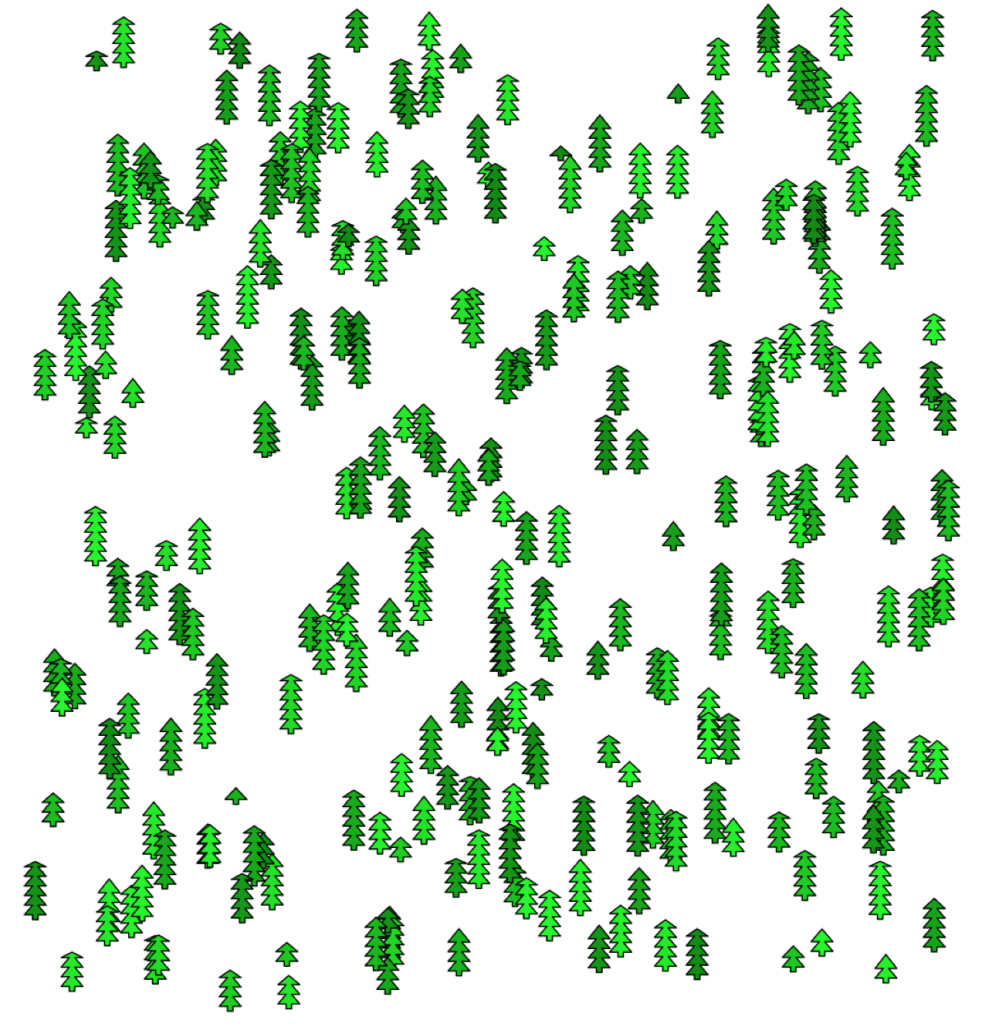
Let’s create a new geom geom_christmas_tree() that will plot data with the use of christmas trees instead of points. The geom will support following aesthetics: size, fill, color, x and y. The size will be translated into the number of segments of each single tree. Width of a tree is fixed and height is proportional to the size. Let’s start with an example.
# generate random positions, colors and sizes
mm = data.frame(matrix(runif(1200),300,4))
# plot
ggplot(mm, aes(X1, X2, size=X3, fill=X4)) +
geom_christmas_tree() +
theme_void() + scale_fill_gradient(low='green1', high='green4')
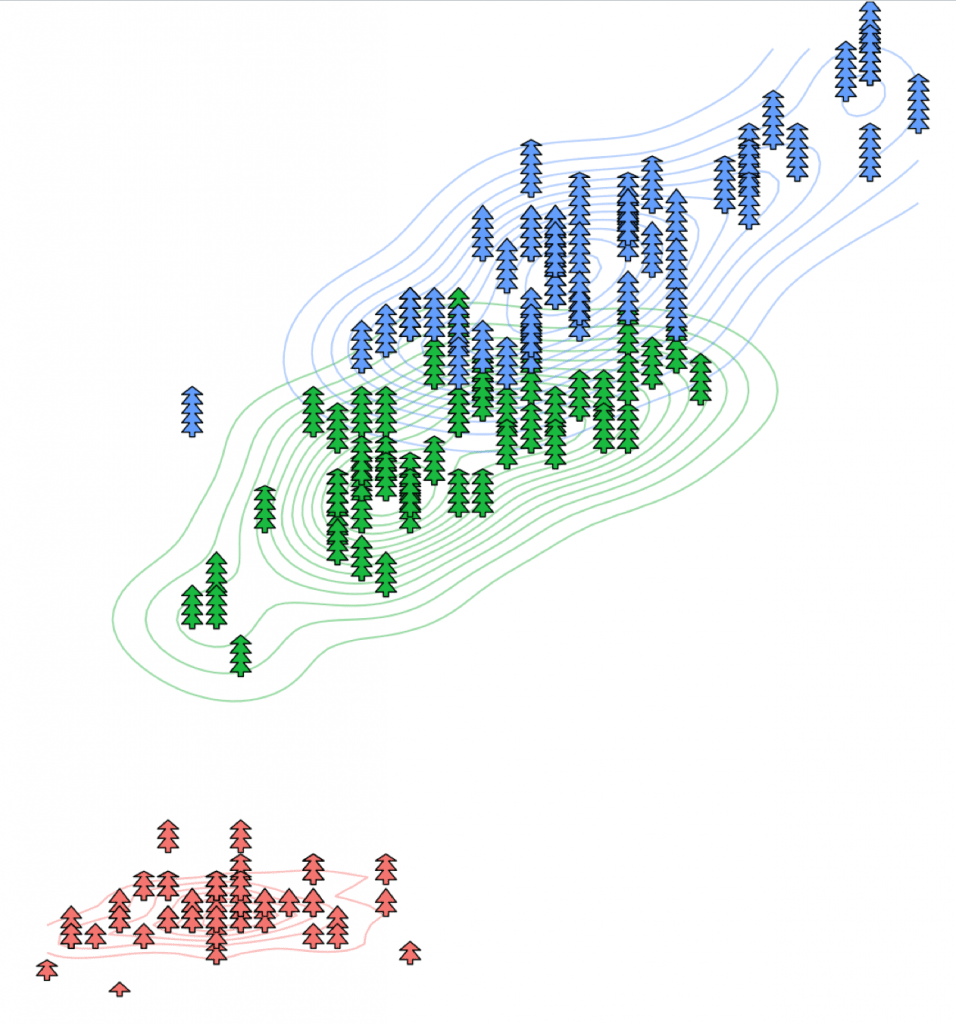
One can combine this geom with other geoms (like contours).
ggplot(iris, aes(x=Sepal.Length, y=Petal.Length, size=Petal.Length, fill=Species)) +
stat_density_2d(aes(color=Species)) +
geom_christmas_tree() +
theme_void() + theme(legend.position="none")
And here we have the definition of the geom.
GeomChristmasTree = ggproto('GeomChristmasTree', Geom,
required_aes = c('x', 'y'),
default_aes = aes(shape = 19, colour = 'black',
fill = 'green4', size = 3,
linetype = 1, alpha = 1,
fontsize = 1),
draw_key = draw_key_polygon,
draw_panel = function(data, panel_scales, coord) {
coords = coord$transform(data, panel_scales)
# each tree is 4*branch + 4
if (length(coords$size) == 1) {
tsize = rep(pmax(1, round(coords$size)), length(coords$x))
theight = rep(pmax(0, round(coords$size)), length(coords$x))
} else {
tsize = pmax(1, round(coords$size))
theight = pmax(0, coords$size)
}
# the scale factor
r01x = diff(range(coords$x))/100
r01y = diff(range(coords$y))/100
# coords
longx = unlist(lapply(seq_along(coords$x), function(i) {
if (tsize[i] == 1) {
dx = -c(0.3, 0.3, 1.2, 0, -1.2, -0.3, -0.3)
} else {
dx = -c(0.3, 0.3, rep(c(1.2,0.3), tsize[i]-1), 1.2, 0, -1.2, rep(c(-0.3,-1.2), tsize[i]-1), -0.3, -0.3)
}
r01x*dx + coords$x[i]
}))
longy = unlist(lapply(seq_along(coords$y), function(i) {
if (tsize[i] == 1) {
dy = c(-0.5, 0, 0, theight[i], 0, 0, -0.5)
} else {
dy = c(-0.5, 0, 0, rep(1:(tsize[i]-1), each=2), theight[i], rep((tsize[i]-1):1, each=2), 0, 0, -0.5)
}
r01y*dy + coords$y[i]
}))
longid = unlist(sapply(seq_along(coords$y), function(i) {
rep(i, each=4*tsize[i]+3)
}))
grid::polygonGrob(
longx,
longy,
id = longid,
gp = grid::gpar(col = coords[,'colour'],
fill = coords[,'fill'],
fontsize = 10)
)
}
)
geom_christmas_tree = function(mapping = NULL, data = NULL, stat = 'identity',
position = 'identity', na.rm = FALSE, show.legend = NA,
inherit.aes = TRUE, ...) {
layer(
geom = GeomChristmasTree, mapping = mapping, data = data, stat = stat,
position = position, show.legend = show.legend, inherit.aes = inherit.aes,
params = list(na.rm = na.rm, ...)
)
}