Table of contents
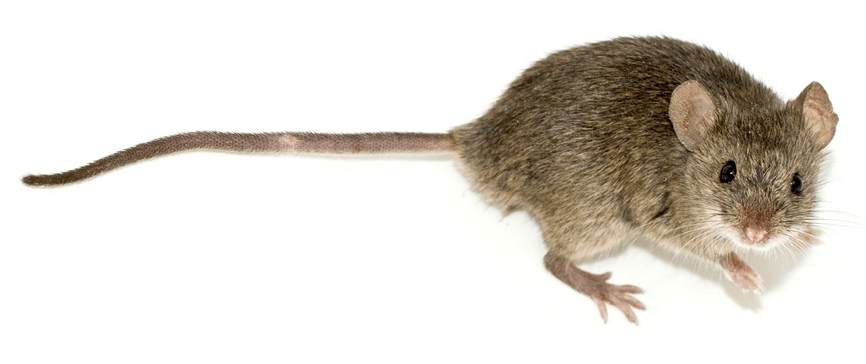
I’ve recently worked on an interesting problem. There are two types of mice. We select three animals of each type. We want to examine an effect of given treatment on nerve cells, more specific: on their dendritic spines (small protrusions located at neurons). From each selected mouse we collect samples of its brain and we apply two different treatments to each sample. Then we take several dozen photos of each sample and we mark hundreds of dendritic spines on each photo.
Table of contents
We measure parameters of the spines but the measurements are not independent. We need to consider the effect of photo’s nested in the effect of brain sample nested in the effect of mouse which is in turn nested in the effect of type of mice. Our goal is to compare four experimental conditions (combination of the type of mice and the type of treatment).
How we can model this?
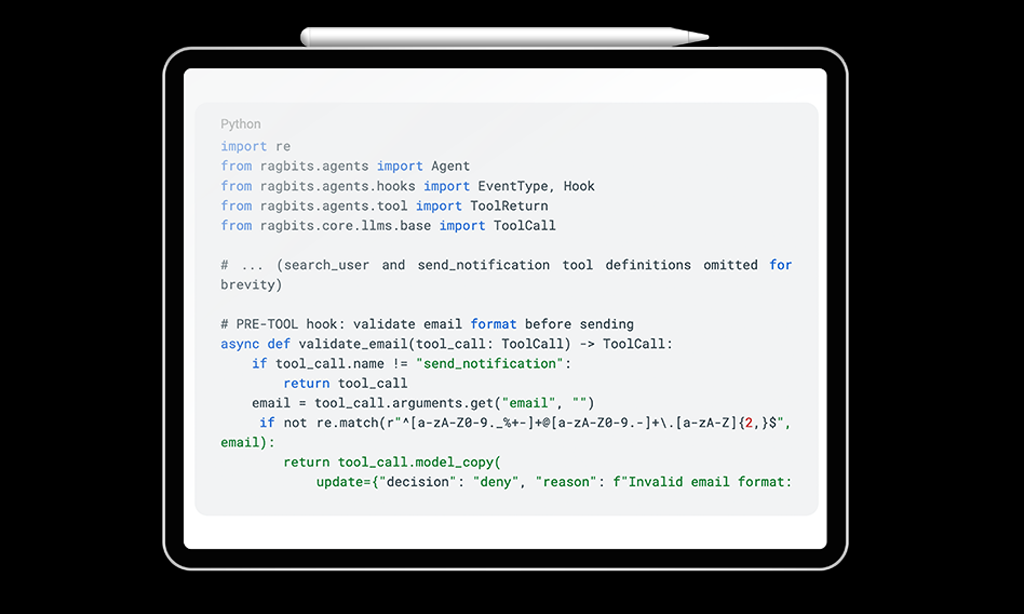
As we are not particularly interested in the effects of mouse, brain sample and photo, we used the random effects to describe them. The effects of mouse and treatment type are directly interesting so we used the fixed effects to describe them. All together we get mixed models, that is, the lmer function from the lme4 package.
mmodel = lmer(spine ~ type*treatment +

(1|animal:type) + (1|animal:type:sample) + (1|animal:type:sample:photo),

data=spines)
I was looking for a function for post hoc testing and I found the lsmeans function in the package bearing the same name (functionality borrowed from the LSMEANS SASa procedure). The package allows for testing many various contrasts. For example, the following command compares all pairs using Tukey’s post hoc procedure.
ms6 = lsmeans(mmodel, pairwise~ type*treatment, adjust="tukey")
The only disadvantage of that package is lack of function for graphical presentation of the post hoc test’s results. On the other hand in SAS one can use diffograms to graphically present post hoc tests. I felt uneasy that I could not find them in R so I wrote a diffogram function myself (see the package DendriticSpineR).
Below you can see an example diffogram.
diffogram(ms6)
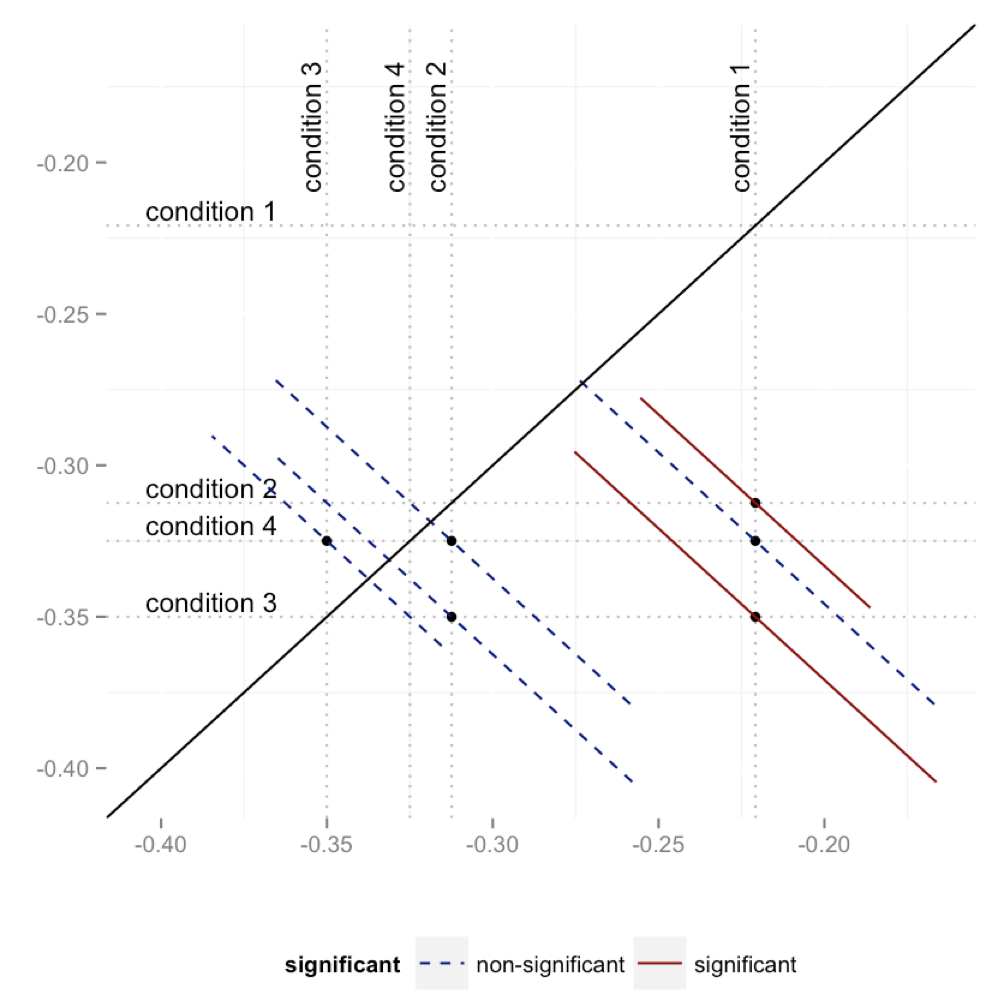
Reading diffograms is a very interesting activity. They display values of individual effects (four dashed lines on both OX and OY axes) as well as results of pair-wise tests (four means gives six pairs) and confidence intervals for the differences. You can find more information on how to read diffograms and why they are a convenient technique for presenting post hoc tests’ results here.
Przemyslaw Biecek