Table of contents
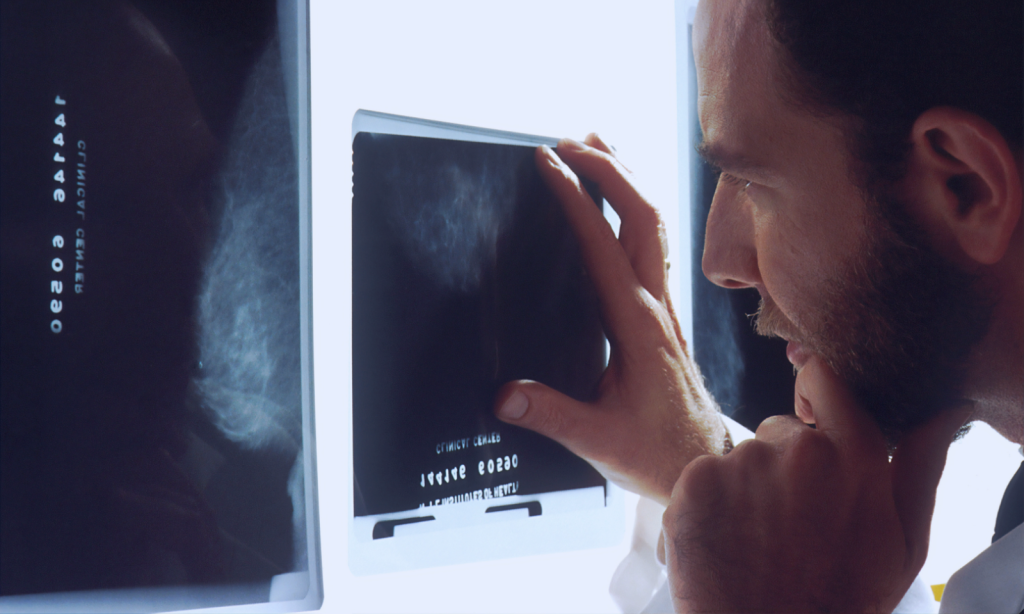
If you’ve met medical AI through headlines, it looks tidy. Last year’s Nobels put AI’s role in protein structure prediction on center stage, and every few weeks, there’s another story about models that can detect cancer earlier and earlier, or promise sharper diagnostics. From a distance, it reads like rarefied science – the sort of thing you only touch with a medical degree.
Up close, the work looks different. Hospitals are busy, scanners are tired, and most of the systems that make a difference are built by regular engineers. You don’t need to be a clinician to contribute; you do, however, need to be comfortable with messy data, ambiguous text, and a few habits the real world refuses to break. And that’s what this post is about – the unexpected caveats and practical problems you run into when you try to make medical AI work in the real world.
TL;DR
Clinical ML isn’t drug discovery, but it’s about messy reports, mislabeled studies, and workflows that don’t follow textbooks. DICOM helps, but metadata lies. Every hospital site is its own universe, and retraining is the norm, not the exception. Text is dictated and hedged, images are huge and artifact-prone, and metrics must reflect clinical consequences.
The mantra: verify → simplify → re-check. Build for wards, not slide decks.
Why Read This
Most writing on Medical AI glamorizes breakthroughs. This piece shows what really breaks when you try to ship ML into hospitals, and how to fix it.
What You’ll Learn
- How to spot 20–30% mislabeled “chest X-rays” before they tank your model.
- Why dictation errors and acronyms make clinical text tougher than NLP benchmarks.
- How MRI, CT, and ultrasound quirks reshape preprocessing choices.
- Why weak supervision and site-specific adapters matter more than “state of the art”.
- Which metrics actually guide clinical outcomes.
Medical AI vs. Clinical ML: Where This Story Begins
“Medical AI” is an extremely broad term that bundles two worlds. There’s “pharma ML” – drug discovery, trials, evaluation. It usually does require, if not a degree, then at least a very solid understanding of medicine, chemistry, or biology. And there’s “clinical ML” — the work that faces patients and clinicians directly: imaging, diagnostics, reports, workflow tooling, bookkeeping. For the purpose of this post, we’ll focus on the clinical aspect, the part usually handled by regular ML engineers. It isn’t a tour of a SOTA model; it’s a look at the everyday engineering that keeps these systems useful.
Why Medical AI Is About Messy Data
Before we dive into the particular challenges one might encounter, let’s start with the foundation of an ML project: the data. Where it comes from, what it looks like, and why it is the way it is. That will help us see why certain challenges appear once we start working with it.
From Clinic to Clinic: The Hidden Journey of a Scan
Patients often imagine a straight line: a clinic visit, a doctor performs a few examinations, reads the scan, a report is written, done. In practice, the path is less linear. In reality, many clinics are understaffed, so studies are often routed to third-party analysis centers. The case leaves the clinic, lands on another workstation, is read, and comes back. Each hop adds context and small inconsistencies: scanner model and software version, acquisition timings, reconstruction settings, contrast notes, links to prior exams, and operator habits.

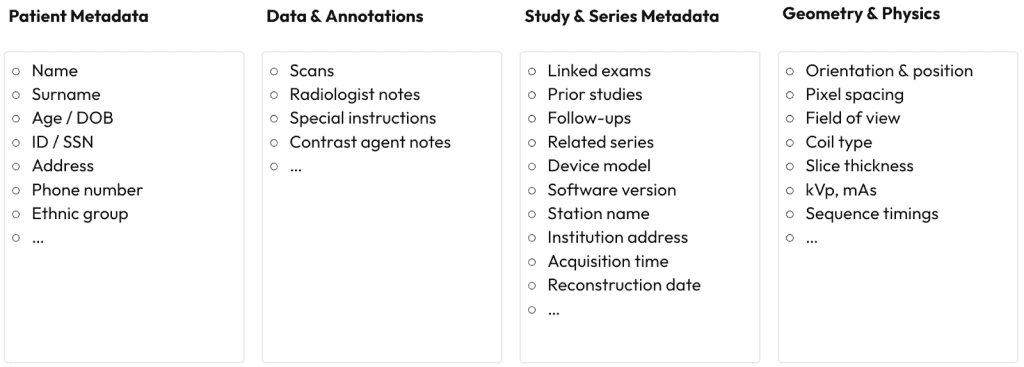
Why Every Medical Sample Is Really a Data Ecosystem
By the time a study reaches your pipeline, it’s not “an image with a report” – it’s a small ecosystem: patient metadata (IDs, DOB, contacts), data & annotations (scans, notes, instructions, contrast), study/series metadata (links to priors, device model & software, station/institution, acquisition & reconstruction times), and technical information (orientation/position, pixel spacing, field of view, coil, slice thickness, kVp/mAs, sequence timings).
That in itself has no problems ML-wise. If anything, the more data we have, the more wiggle room we have as ML engineers. Perhaps the only question at this stage is how to store all that data.
> Imagine the chaos if every clinic were to invent its own data format
We’ve delivered AI that accelerates drug discovery, optimizes patient care, and streamlines hospital workflows.

DICOM: The Almost Perfect Standard
Luckily, the standard does exist and is called DICOM (Digital Imaging and Communications in Medicine). It’s a fairly complex data protocol, but the two main pros of it are that:
- It standardizes almost all the metadata there is into pre-defined fields
- It is supported by virtually everything in the medical world and is the de facto standard for storing medical information

But no single standard can capture everything people do in clinics, and the gaps are where engineering starts.
When Metadata Lies: Why 20–30% of ‘Chest X-Rays’ Aren’t
If you ever skim the DICOM spec, you’ll find a field for almost everything. The catch is that the obvious things aren’t always there in a clean, consistent way. Sites improvise. Pregnancy status is described in free-text or other random fields. Mobility limitations get tucked into an “occupation” field. Insurance type, crucial in some markets, lands in “military rank,” which is otherwise idle. None of this is malicious; it’s what happens when real workflows outgrow a tidy schema.
The part that oftentimes bites engineers is even simpler: values don’t always get updated between patients. A technologist sets “body part” to chest for one case, rushes to the next, and the field rides along. Now you curate a training set for pneumonia: filter for chest X-rays, pull a few thousand “matches”… and 20-30% are elbows, knees, or hands – sometimes not even X-Rays. It may appear to be poor labeling; in practice, it’s an understandable shortcut that becomes a modeling problem the moment you rely on it.
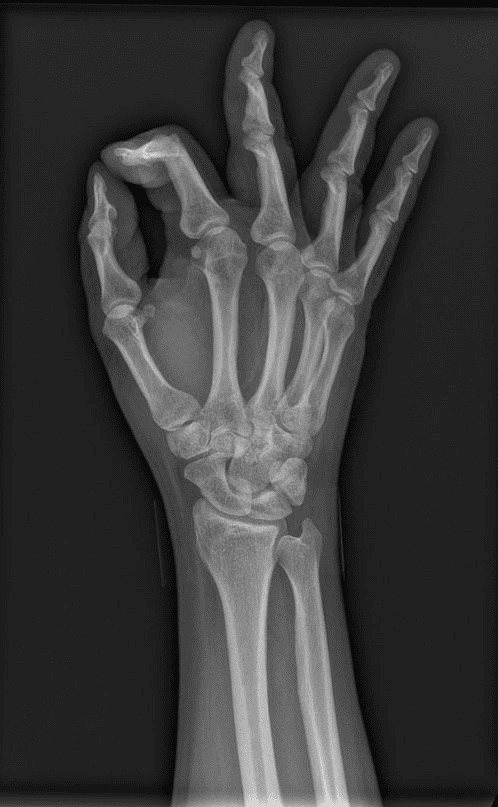
Chest X-Ray, clearly
Metadata Is a Hint, Not the Ground Truth
Treat metadata as a hint, not an answer. Here are a few habits that make the mess manageable:
- If possible, always run your own small annotation rounds before trusting a single filter; examine the images and reports together and extract signal from every source you can legally. That will save you an immense amount of time and headache once you start working on the modelling.
- Assume every site is its own world. Inside a site, people tend to be consistent; across sites, they aren’t. Plan for that: build per-site adapters, expect domain drift when a new template or device shows up, and treat retraining as routine rather than a rescue.
- Don’t wait for a perfect universal schema. Create a compact standard that fits your use case, write down a single ontology of entities you actually need, and map each site’s notions into yours. Once that mapping exists, the rest of the pipeline becomes predictable.
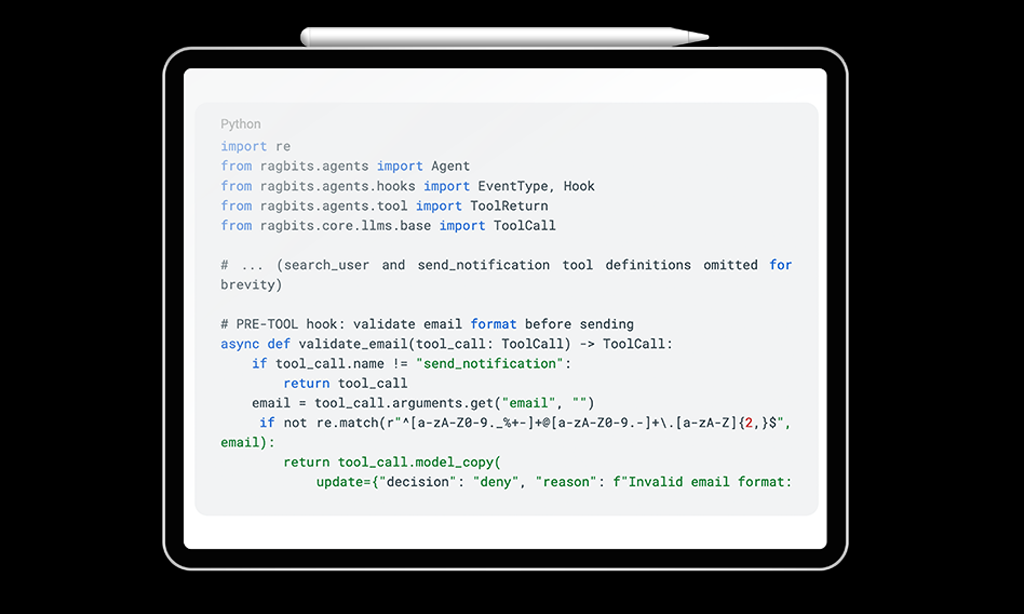
When Clinical Text Lies: Dictation Errors, Acronyms, and Ambiguity
Another thing people rarely think about: not all clinical text is typed by hand. Sometimes it is, but given how much writing clinicians do in a day, it’s natural to lean on speech-to-text. That single choice explains a lot of the weirdness you’ll see. Dictation brings conversational speech into systems that want structure. Small mistakes creep in; some survive review. On average, you’ll see several errors per hundred transcribed words, and even final, physician-signed notes keep a few. Most are harmless, some are funny (“seen by cardiologist” becoming “assaulted by cardiologist”), and a few are dangerous (an extra zero turning 8 units into 80).

From PT to T2MI: The Language Chaos in Clinical Reports
Abbreviations layer on more ambiguity. “PT” might be physical therapy, prothrombin time, patellar tendon, patient, preterm, or parathyroid. Single letters carry multiple meanings (B for breast/brain/blood/bladder, L for liver/lung), and acronyms like T2MI don’t always land as intended. And although oftentimes it’s possible to infer meaning from context, sometimes even clinicians disagree about what a term means in a given sentence; your model will too.
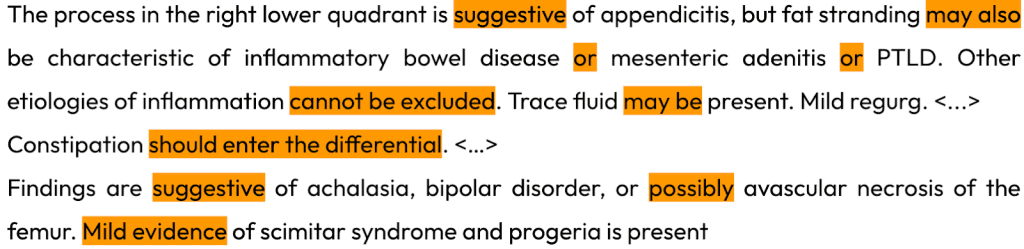
All of that, dictation quirks and overloaded abbreviations, would be manageable on its own. What really tilts the text is the incentive structure. In many jurisdictions, a clinician can be held liable for a missed diagnosis, so the safe move is to hedge. Reports lean on suggestive of, may represent, cannot be excluded, mild evidence of. Negations stack, qualifiers multiply, and you end up with sentences that are legally sound but algorithmically ambiguous. Sometimes it’s challenging even for fellow humans to parse and make sense of, let alone for a model.
Practical Steps for Making Clinical Text Usable
So what do you do with reports like this?
- Start small. In practice, compact, task-specific models work best here: BERT/RoBERTa-class, fine-tuned for one job at a time.
- Solve the pieces in sequence rather than in one go: first scope negations, then handle uncertainty, then tackle a single clinical finding; only after that worry about the long tail.
- Keep the simple tools close – heuristics and regex are everywhere in medicine for a reason, and some chores (template cleanup, sectioning, boilerplate stripping) aren’t an ML problem at all.
- And most importantly, don’t try to do this in a vacuum: get someone with a clinical background to look over edge cases and label rules. Ten minutes of that review saves days of rework.
With text under control, the next surprises live in the images.
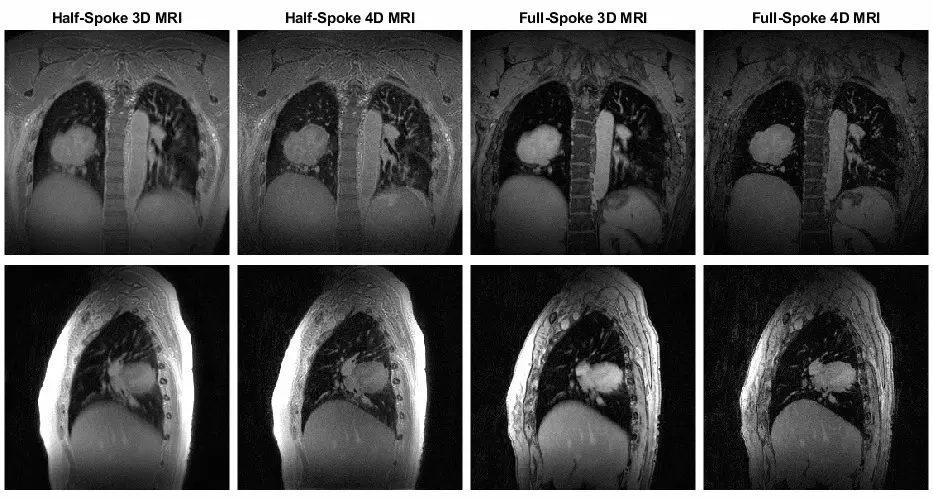
From 2D X-Rays to 4D Cine Loops: The Scale of Medical Imaging
Vision work in medicine appears familiar until the scale is introduced. X-rays are 2D and straightforward; CT and MRI arrive as 3D volumes; cine loops add time as a fourth dimension. Size climbs fast. A single brain MRI can be several gigabytes; a full-body study can be tens of gigabytes. So storage, throughput, preprocessing, and model choice all become part of the job. Even a modest 3D network will be significantly heavier than a large 2D one before you add any additional features.
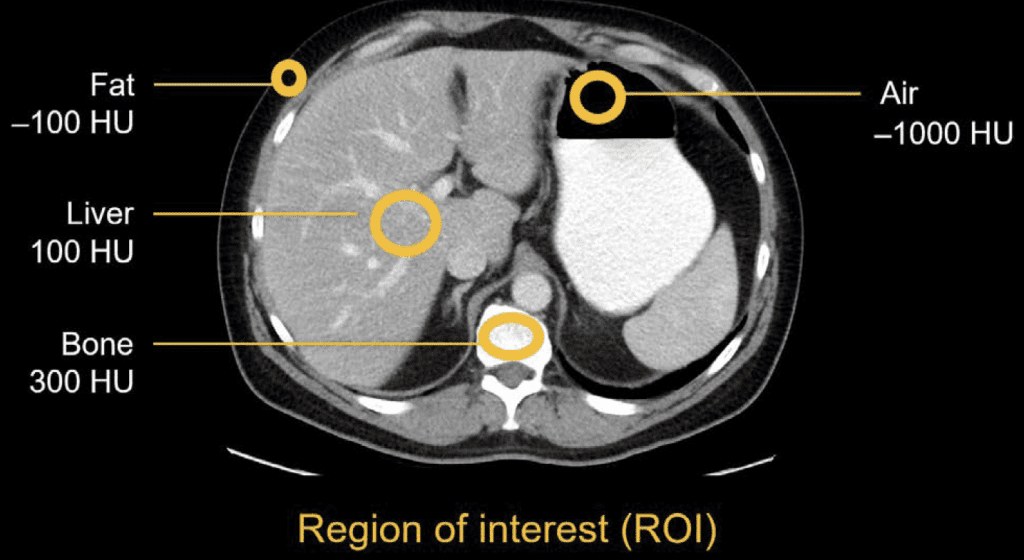
CT, MRI, and Ultrasound: When Images Contain Physics
One important thing to remember when working with medical images is that not every image is “just a picture. Some modalities carry physical units in the pixels. CT (and in some cases X-ray) values are in Hounsfield Units (air ~= −1000, water ~= 0, cortical bone ~= 1000+). That can be extremely handy when you only need to look at specific structures in isolation, filtering the surrounding noise. X-ray intensities reflect path-length attenuation, so darker/brighter isn’t arbitrary contrast; it’s the beam’s journey through tissue and hardware. By contrast, MRI brightness is mostly relative; it depends on sequence, timing, and coil gain, which is why two “similar” scans can look different without anyone doing anything wrong. Ultrasound brings its own texture (speckle) and angle dependence. All of this matters for preprocessing and for what you let the model learn.
When Artifacts Break Your Model
Then come the artifacts. Patients move and breathe; implants reflect rays and bloom; noise changes with the scanner and protocol; contrast phases alter how tissue appears; rings and beam-hardening artifacts appear when you least want them. If you train only on clean slices, the first busy day on the ward will cause the model to appear lost.
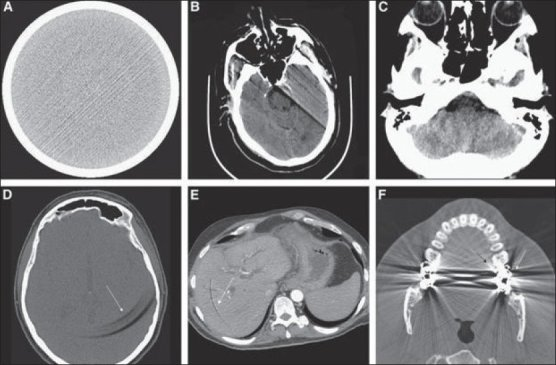
(A) Streak (B) Motion (C) Beam-hardening (D-E) Ring (F) Bloom
Labels don’t make life easier. Reports don’t always line up with what’s in the pixels, metadata is still creative, and the findings you care about are often rare by definition. Class imbalance isn’t a corner case here; it’s the water you swim in.
A Practical Pattern for Surviving Clinical ML Chaos
There’s a pattern that keeps projects steady:
- Similar to text and metadata, re-annotate when possible.
When you can’t, use weak or semi-weak supervision that mirrors how labels are produced in the first place. - Cut the fat off your data: merge slices when fine detail isn’t the goal, use multi-view (2.5D) for classification.
When it comes to segmentation, where details are crucial, the most popular way to go is to chunk your samples into smaller pieces, perform inference per-chunk, and merge the results later. - Don’t be shy about augmentations; real scans are harsher than your training loop anyway.
Metrics Should Follow the Medicine, Not the Textbook
From the technical perspective, two things I found particularly useful are the ASL loss, which works extremely well in multi-label setups, even when concepts overlap, and SAM (not to be confused with the Segment Anything Model) makes the training loop more stable.
Another thing, albeit not unique to medicine, is that metrics should follow the action you want someone to take. With heavy imbalance, MCC usually beats F1 because it’s symmetric – it doesn’t change when you swap which class is “positive,” while F1 can. For anonymization, for example, the cost of leaking PHI is far higher than over-redacting, so you bias toward recall and live with lower precision. If the clinical goal doesn’t fit a textbook metric, don’t be afraid to define one yourself.
And always, look at the data. Early and often. A few regular sessions of just scrolling through studies will surface stale “body part” tags, half-masked overlays from upstream anonymization, odd export LUTs, and other quirks long before they start causing problems. Give it a couple of weeks, and you’ll start to read the images and reports well enough to spot trouble before your metrics do.
Conclusion
That’s the shape of it. Don’t trust metadata; if possible, review the images and reports and annotate a small sample yourself. Keep someone with clinical experience in the loop. Expect artifacts, in text and in pixels, and treat them as normal, not exceptions. Build small adapters for each site, as conventions vary from place to place. Also, plan to trim the fat from your datasets so you’re training on what actually matters, rather than everything you could collect.
It can look intimidating from the outside, but it isn’t mystical. You pick it up quickly, and the work turns into a rhythm: verify, simplify, re-check. Do that, and the models will behave in clinics, not just in slides.
Table of contents