Table of contents
Table of contents
Today we will use ggplot2 to recreate the diagrams presenting support in voting intention polls conducted before presidential elections. The story behind is interesting so let’s see it again. Yesterday RStudio has released a new version of shiny. Version 0.12 comes with very interesting feature: events like click, double_click, hover are observable. Application may respond to them.
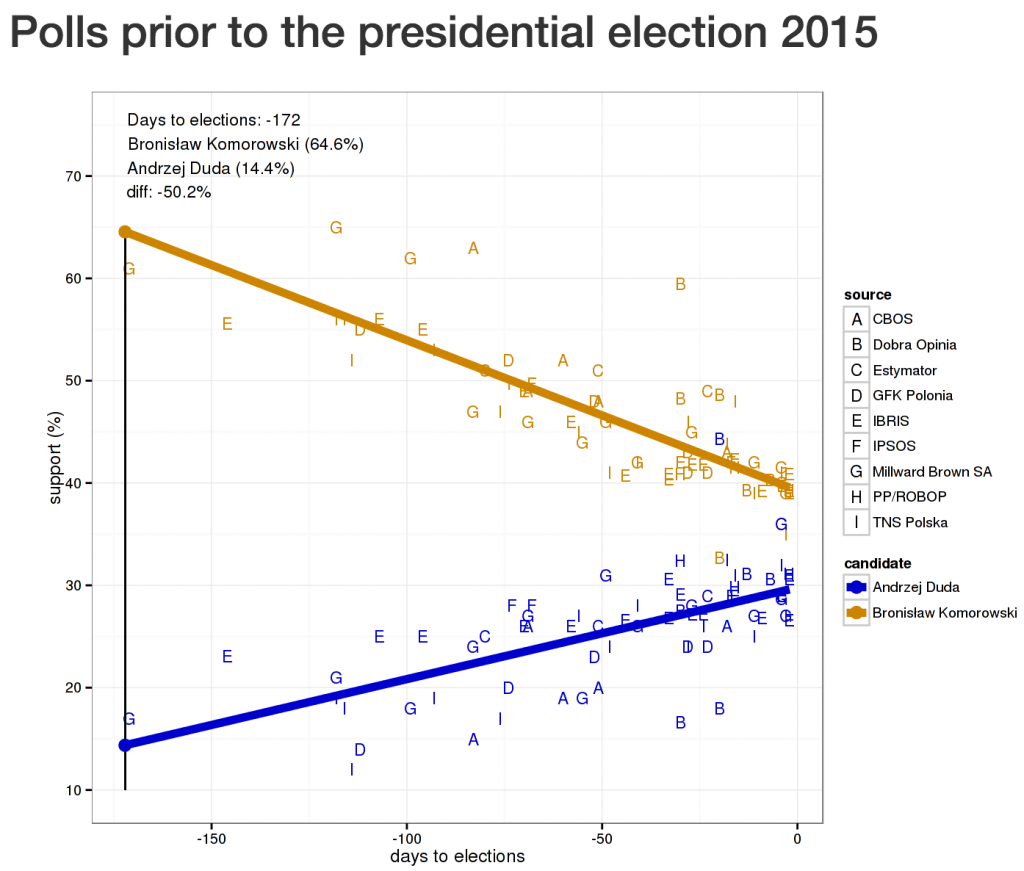
Let’s start with an example. You may move your mouse cursor over the app bellow to see the local difference between both candidates. [Because the app cannot be embedded here, open it in a new window first]. Notice that the difference in estimated support shrinked from 50% to 10% in 6 months. Moreover the difference in expected support in the election day was in fact 10 percent points smaller (AD won slightly over BK). Why results from polls were so wrong?
 How the app was created? Below, you will find a step by step instruction.
Let us start with loading the data. The data is available in the rds file at https://github.com/pbiecek/SmarterPoland_blog/tree/master/2015/wybory2015b. Download it first and following commands load the data and display its first rows.
How the app was created? Below, you will find a step by step instruction.
Let us start with loading the data. The data is available in the rds file at https://github.com/pbiecek/SmarterPoland_blog/tree/master/2015/wybory2015b. Download it first and following commands load the data and display its first rows.
 The last step is to create an interactive application. Shiny package allows us to do this easily. Below you fill find both ui.R and sever.R. Notice the ‘plot_hower’ part where hover_event is dispatched.
ui.R
The last step is to create an interactive application. Shiny package allows us to do this easily. Below you fill find both ui.R and sever.R. Notice the ‘plot_hower’ part where hover_event is dispatched.
ui.R
How the app was created? Below, you will find a step by step instruction.
Let us start with loading the data. The data is available in the rds file at https://github.com/pbiecek/SmarterPoland_blog/tree/master/2015/wybory2015b. Download it first and following commands load the data and display its first rows.
load("elections1.rda")
head(elections1)
source       date            candidate support daysToElections
2         CBOS 2015-02-16 Bronislaw Komorowski    63.0             -83
3         CBOS 2015-03-02 Bronislaw Komorowski    49.0             -69
4         CBOS 2015-03-11 Bronislaw Komorowski    52.0             -60
5         CBOS 2015-03-20 Bronislaw Komorowski    48.0             -51
6         CBOS 2015-04-22 Bronislaw Komorowski    43.0             -18
9 Dobra Opinia 2015-04-10 Bronislaw Komorowski    48.3             -30
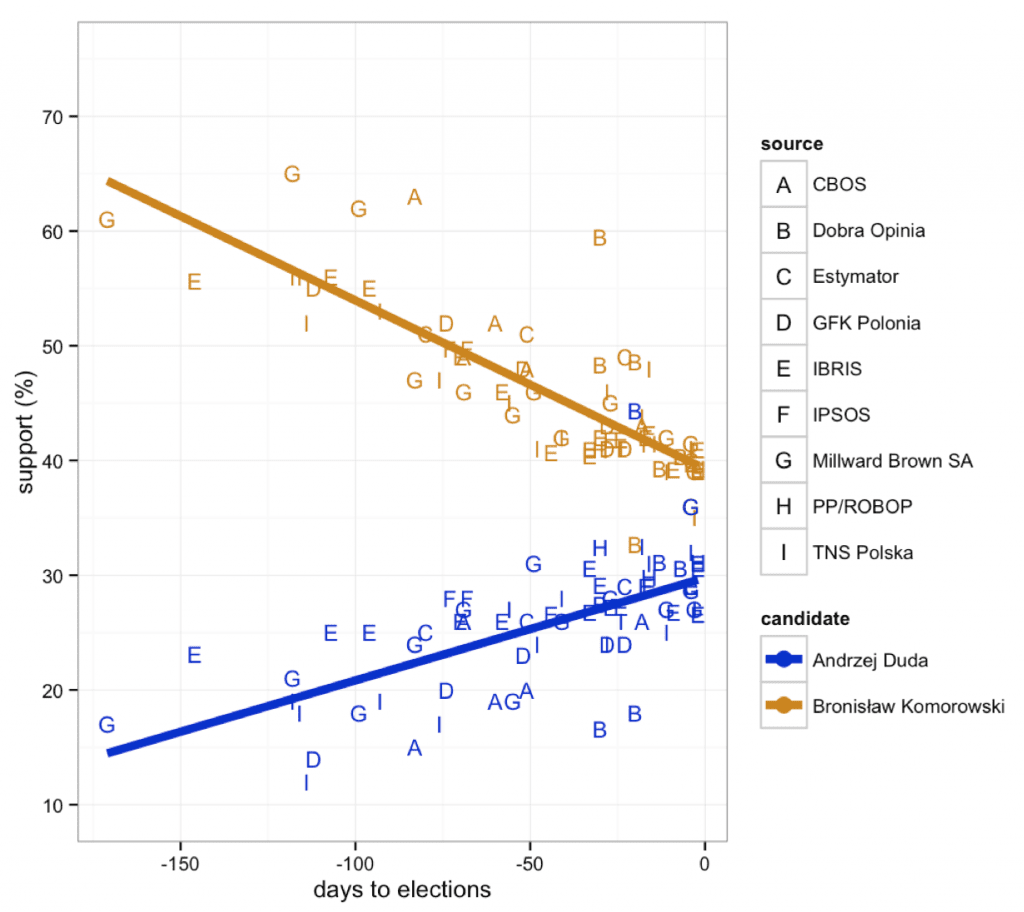
Let us create a scatterplot. We will use dots to mark support, colors to mark the candidates and shapes of the dots to mark the opinion poll centres that conducted the polls. By the way, it is actually better to mark the centers with letters than shapes it’s easier to recognize them (we use the scale_shape_manual function for that purpose).
ggplot(elections1, aes(x=daysToElections, y=support)) +
geom_point(aes(shape=source, color=candidate), size=4) +
scale_shape_manual(values=LETTERS) + theme_bw() +
xlab("days to elections") + ylab("support (%)") +
scale_y_continuous(limits=c(10,75), breaks=seq(10,70,10)) +
geom_smooth(size=2,aes(color=candidate),se=FALSE, method="lm") +
scale_color_manual(values=c("blue3", "orange3"))
The last step is to create an interactive application. Shiny package allows us to do this easily. Below you fill find both ui.R and sever.R. Notice the ‘plot_hower’ part where hover_event is dispatched.
ui.R
library(shiny)
load("elections1.rda")
shinyUI(fluidPage(
titlePanel(h2("Polls prior to the presidential election 2015")),
sidebarLayout(
sidebarPanel(
checkboxGroupInput("pola", "Show results for",
unique(elections1$source)[1:9], unique(elections1$source)[1:9]),
p("Dev:", HTML("
Fundacja SmarterPoland.pl
"))
),
mainPanel( plotOutput("plot", width = 700, height = 550,
hover = hoverOpts(id = "plot_hower")))
)
))
server.r
library(ggplot2)
library(scales)
library(lubridate)
load("elections1.rda")
shinyServer(function(input, output) {
position = reactiveValues(x = NULL)
# update position on hover
observeEvent(input$plot_hower, {
hower = input$plot_hower
if (!is.null(hower)) {
position$x = hower$x
}
})
# render plot if change in hover or pola
output$plot = renderPlot({
elections = elections1[elections1$source %in% input$pola,]
pl = ggplot(elections, aes(x=daysToElections, y=support)) +
geom_point(aes(shape=source, color=candidate), size=4) +
scale_shape_manual(values=LETTERS) + theme_bw() +
xlab(“days to elections”) + ylab(“support (%)”) +
scale_y_continuous(limits=c(10,75), breaks=seq(10,70,10)) +
geom_smooth(size=2,aes(color=candidate),se=FALSE, method=”lm”)
# here you need to calculate the average support at the given time
if (!is.null(position$x)) {
pl = pl + geom_linerange(x=position$x, ymin=10, ymax=65)
cand = c(“Bronislaw Komorowski”, “Andrzej Duda” )
npoints = predict(lm(support~daysToElections*candidate, data=elections1),
newdata = data.frame(daysToElections = position$x,
candidate=cand))
ndf = data.frame(candidate=cand, support=npoints, daysToElections = position$x)
ndf2 = data.frame(support=72, daysToElections = position$x,
text=paste0(“Days to elections: “,round(position$x),”n”,
paste0(cand, ” (“, round(npoints,1), “%)”, collapse=”n”),
“ndiff: “, round(diff(npoints),1), “%”))
pl = pl + geom_point(data=ndf, aes(color=candidate), size=4) +
geom_text(data=ndf2, aes(x=daysToElections, y=support, label=text), size=4, hjust=1+position$x/170)
}
pl + scale_color_manual(values=c(“blue3”, “orange3”))
})
})
Przemyslaw Biecek