deepsense.aideepsense.ai logo
  • Careers
    • Job offers
    • Summer internship
  • Clients’ stories
  • Services
    • AI software
    • Team augmentation
    • AI advisory
    • Train your team
  • Industries
    • Retail
    • Manufacturing
    • Financial & Insurance
    • IT operations
    • TMT & Other
    • Medical & Beauty
  • Knowledge base
    • Blog
    • R&D hub
  • About us
    • Our story
    • Management
    • Advisory board
    • Press center
  • Contact
  • Menu Menu
Exploration of data from iPhone motion coprocessor (2)

Exploration of data from iPhone motion coprocessor (2)

January 21, 2016/in Data science /by Przemyslaw Biecek

Last week we have downloaded and loaded into R data from fitness tracker (motion coprocessor in iphone). Then with just few lines of R code we decomposed the data into a seasonal weekly component and the trend. Today we are going to see how to plot the number of steps per hour for different days of week. And then same data will be used to check how often there was any activity at given time.

So, first, let’s load the data from the xml file.

require(ggplot2)
require(dplyr)
library(lubridate)
require(XML)
data <- xmlParse("eksport.xml")
xml_data <- xmlToList(data)
xml_dataSel <- xml_data[sapply(xml_data, function(x) (!is.null(x["type"])) & x["type"]== "HKQuantityTypeIdentifierStepCount")]
xml_dataSelDF <- data.frame(
  unit=unlist(sapply(xml_dataSel, function(x) x["unit"])),
  day=substr(unlist(sapply(xml_dataSel, function(x) x["startDate"])),1,10),
  hour=substr(unlist(sapply(xml_dataSel, function(x) x["startDate"])),12,13),
  value=as.numeric(as.character(unlist(sapply(xml_dataSel, function(x) x["value"]))))
)
xml_dataSelDF$wday <- wday(ymd(as.character(xml_dataSelDF$day)), label=T)

To plot the activity we need to do some aggregation. Here we will count number of steps per hour per day of a week.

dataDF <- xml_dataSelDF %>%
   group_by(wday, hour) %>%
   summarise(sum = sum(value))
head(dataDF)
# Source: local data frame [6 x 3]
# Groups: wday [1]
#
#     wday   hour   sum
#   (fctr) (fctr) (dbl)
# 1    Sun     00  2013
# 2    Sun     01  2475
# 3    Sun     02   347
# 4    Sun     03   919
# 5    Sun     04  2158
# 6    Sun     05  4062

Great. How to present this data? Of course with ggplot2!
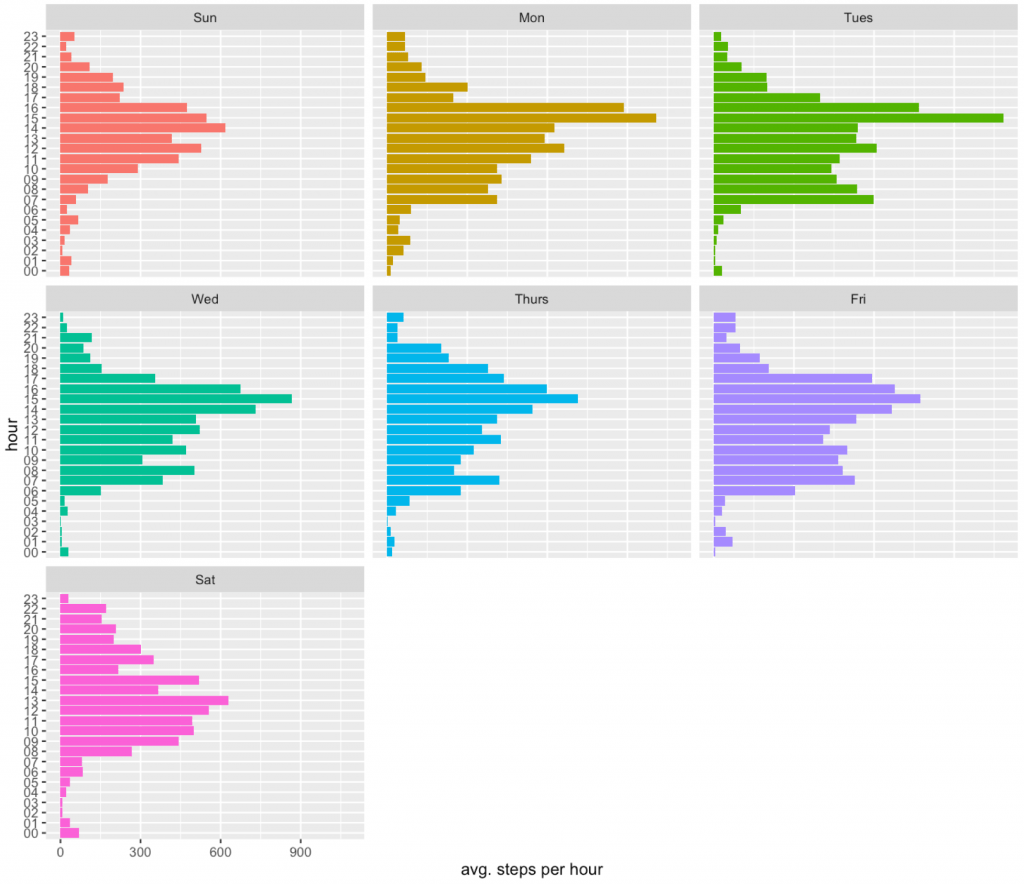
Here the geom_bar geometry will be used to present number of steps per hour for different days of week.
As we see the largest activity is around 4pm (time to collect kids from schools).

ggplot(dataDF, aes(x=hour, y=sum, fill=wday)) +
  geom_bar(stat="identity") +
  facet_wrap(~wday) +
  coord_flip() + theme(legend.position="none") +
  ylab("avg. steps per hour") + xlab("hour")

ip1
We can use such data to try other things.
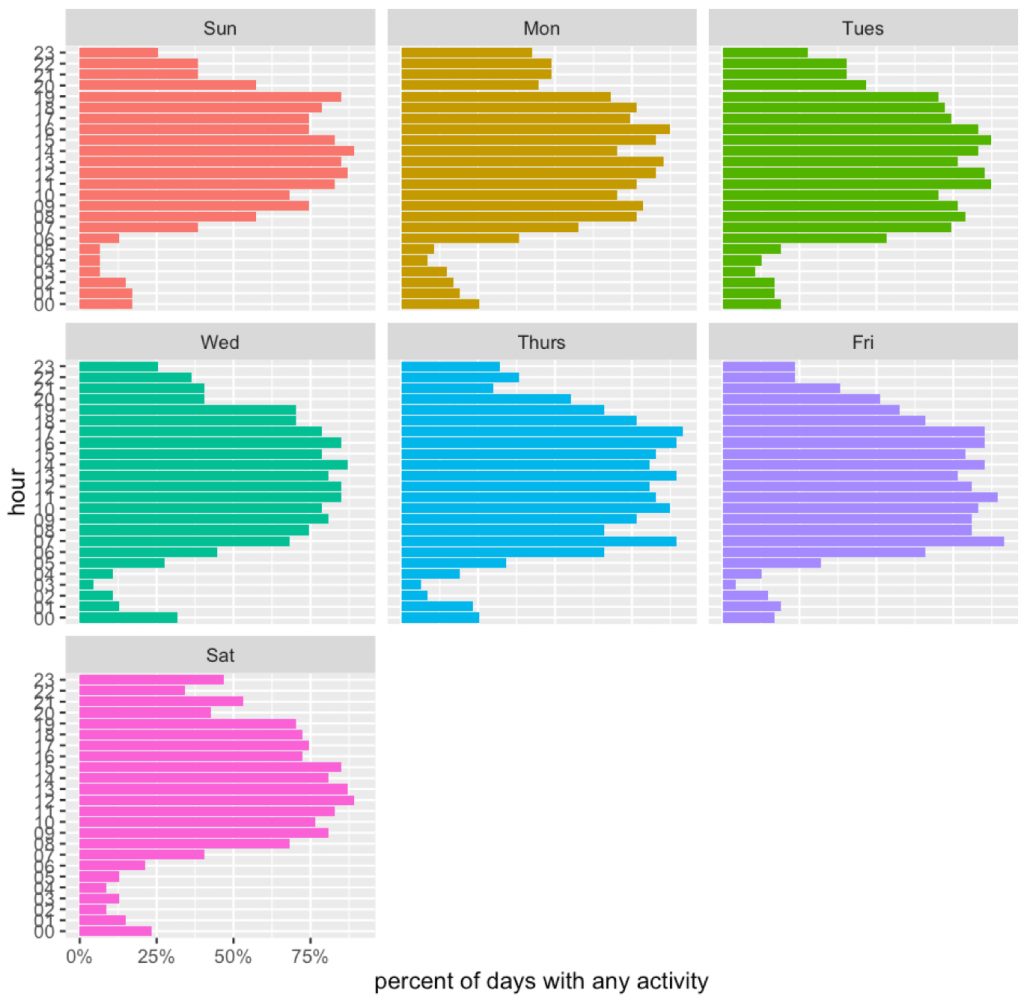
Like for example, one can check if there was any activity during this hour. It will not be 100% accurate, since not always phone is in the pocket.
Then we will compute the fraction of days in which there was any activity during this hour.
Let’s see these patterns.

dataDF <- xml_dataSelDF %>%
  group_by(day, wday, hour) %>%
  summarise(sum = sum(value)>0 + 0) %>%
  spread(hour, sum, fill=0) %>%
  gather(hour, value, -day, -wday) %>%
  group_by(wday, hour) %>%
  summarise(mv = mean(value))
head(dataDF)
# Source: local data frame [6 x 3]
# Groups: wday [1]
#
#     wday   hour         mv
#   (fctr) (fctr)      (dbl)
# 1    Sun     00 0.17021277
# 2    Sun     01 0.17021277
# 3    Sun     02 0.14893617
# 4    Sun     03 0.06382979
# 5    Sun     04 0.06382979
# 6    Sun     05 0.06382979

And the ggplot.

ggplot(dataDF, aes(x=hour, y=mv, fill=wday)) +
  geom_bar(stat="identity") +
  facet_wrap(~wday) +
  coord_flip() + theme(legend.position="none") +
  ylab("percent of days with any activity") + xlab("hour") +
  scale_y_continuous(label=percent)

ip2

Share this entry
  • Share on Facebook
  • Share on Twitter
  • Share on WhatsApp
  • Share on LinkedIn
  • Share on Reddit
  • Share by Mail
https://deepsense.ai/wp-content/uploads/2019/02/Exploration-of-data-from-iPhone-motion-coprocessor-2.jpg 337 1140 Przemyslaw Biecek https://deepsense.ai/wp-content/uploads/2019/04/DS_logo_color.svg Przemyslaw Biecek2016-01-21 22:06:002021-01-05 16:51:47Exploration of data from iPhone motion coprocessor (2)

Start your search here

NEWSLETTER SUBSCRIPTION

    You can modify your privacy settings and unsubscribe from our lists at any time (see our privacy policy).

    This site is protected by reCAPTCHA and the Google privacy policy and terms of service apply.

    THE NEWEST AI MONTHLY DIGEST

    • AI Monthly Digest 20 - TL;DRAI Monthly Digest 20 – TL;DRMay 12, 2020

    CATEGORIES

    • Elasticsearch
    • Computer vision
    • Artificial Intelligence
    • AIOps
    • Big data & Spark
    • Data science
    • Deep learning
    • Machine learning
    • Neptune
    • Reinforcement learning
    • Seahorse
    • Job offer
    • Popular posts
    • AI Monthly Digest
    • Press release

    POPULAR POSTS

    • AI trends for 2021AI trends for 2021January 7, 2021
    • A comprehensive guide to demand forecastingA comprehensive guide to demand forecastingMay 28, 2019
    • What is reinforcement learning? The complete guideWhat is reinforcement learning? deepsense.ai’s complete guideJuly 5, 2018

    Would you like
    to learn more?

    Contact us!
    • deepsense.ai logo white
    • Services
    • Customized AI software
    • Team augmentation
    • AI advisory
    • Knowledge base
    • Blog
    • R&D hub
    • deepsense.ai
    • Careers
    • Summer internship
    • Our story
    • Management
    • Advisory board
    • Press center
    • Support
    • Terms of service
    • Privacy policy
    • Code of ethics
    • Contact us
    • Join our community
    • facebook logo linkedin logo twitter logo
    • © deepsense.ai 2014-
    Scroll to top

    This site uses cookies. By continuing to browse the site, you are agreeing to our use of cookies.

    OKLearn more

    Cookie and Privacy Settings


    How we use cookies

    We may request cookies to be set on your device. We use cookies to let us know when you visit our websites, how you interact with us, to enrich your user experience, and to customize your relationship with our website.

    Click on the different category headings to find out more. You can also change some of your preferences. Note that blocking some types of cookies may impact your experience on our websites and the services we are able to offer.

    Essential Website Cookies

    These cookies are strictly necessary to provide you with services available through our website and to use some of its features.

    Because these cookies are strictly necessary to deliver the website, refuseing them will have impact how our site functions. You always can block or delete cookies by changing your browser settings and force blocking all cookies on this website. But this will always prompt you to accept/refuse cookies when revisiting our site.

    We fully respect if you want to refuse cookies but to avoid asking you again and again kindly allow us to store a cookie for that. You are free to opt out any time or opt in for other cookies to get a better experience. If you refuse cookies we will remove all set cookies in our domain.

    We provide you with a list of stored cookies on your computer in our domain so you can check what we stored. Due to security reasons we are not able to show or modify cookies from other domains. You can check these in your browser security settings.

    Other external services

    We also use different external services like Google Webfonts, Google Maps, and external Video providers. Since these providers may collect personal data like your IP address we allow you to block them here. Please be aware that this might heavily reduce the functionality and appearance of our site. Changes will take effect once you reload the page.

    Google Webfont Settings:

    Google Map Settings:

    Google reCaptcha Settings:

    Vimeo and Youtube video embeds:

    Privacy Policy

    You can read about our cookies and privacy settings in detail on our Privacy Policy Page.

    Accept settingsHide notification only