Table of contents
EDA Benchmark is an open evaluation of how well Large Language Models (LLMs) and agentic systems perform Exploratory Data Analysis (EDA) tasks when both accuracy and repeatability matter.
It is designed for teams assessing whether AI models can be trusted in real data-analysis workflows. These workflows require models to inspect files, clean inconsistent records, combine data sources, detect anomalies, reconstruct events, and return structured results. A useful model must not only solve such tasks once. It must deliver consistently strong results across repeated runs.
The benchmark includes 10 synthetic data-analysis tasks spanning diverse domains. Each model completes every task five times, allowing us to evaluate both the quality of its answers and the consistency of its performance over 50 trajectories in total.
Eight models are compared using two complementary measures:
- mean score, representing average analytical performance;
- reliability-adjusted score, rewarding models that consistently produce strong results across repeated executions.
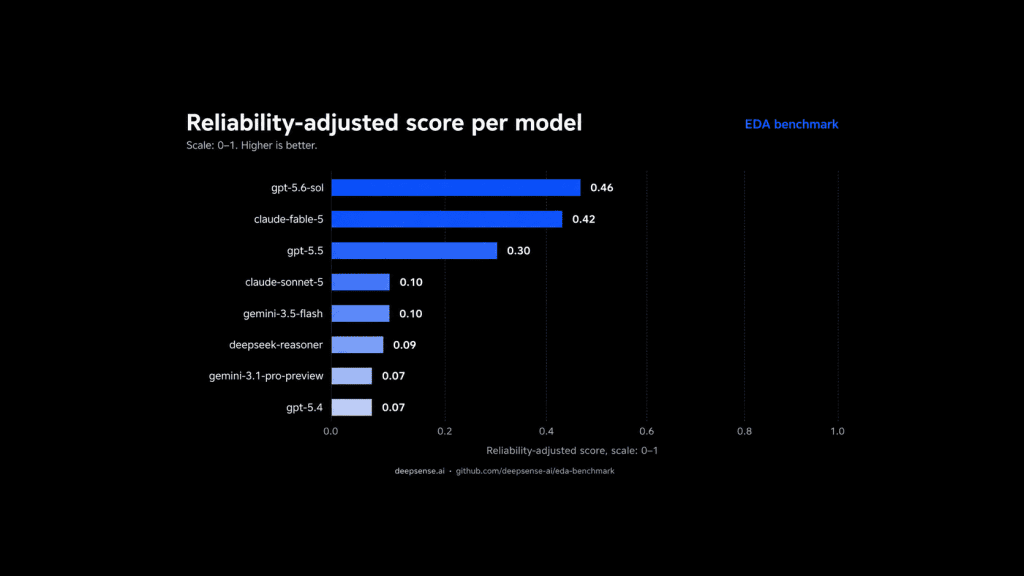
The results reveal an important distinction between analytical accuracy and dependable execution. Claude Fable 5 achieved the highest mean score of 0.50, while GPT-5.6-sol ranked first after reliability adjustment, with a score of 0.46.
This distinction is critical when selecting models for production data-analysis workflows. A model that occasionally produces an excellent answer may still be less useful than one that repeatedly delivers strong and predictable results.
EDA Benchmark makes this difference visible by separating average analytical quality from reliability across multiple runs.
gpt-5.6-sol leads after reliability adjustment
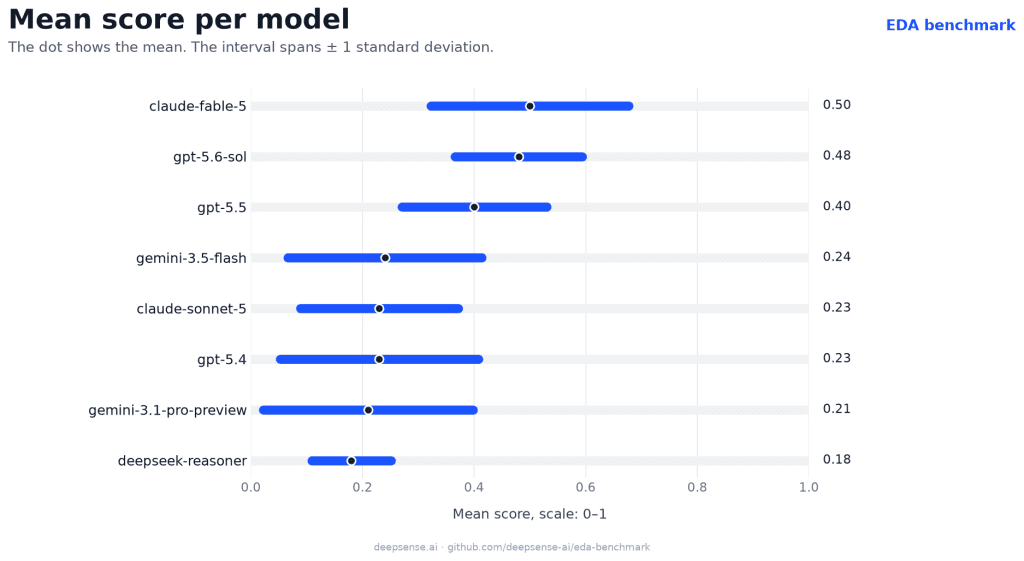
Claude-fable-5 recorded the highest average analytical score, reaching 0.50. Gpt-5.6-sol followed closely with a mean score of 0.48.
The ordering changes when repeatability is included.
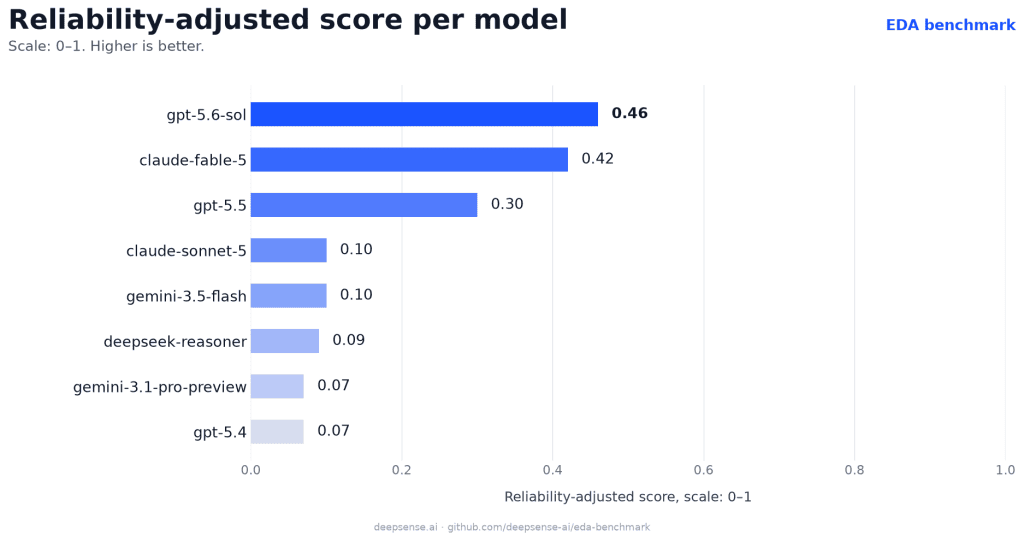
Gpt-5.6-sol achieved the highest reliability-adjusted score of 0.46, ahead of the 0.42 recorded by claude-fable-5. The relatively small difference between its mean and adjusted results indicates comparatively stable performance across repeated trajectories.
This distinction is central to the benchmark. Claude-fable-5 delivered the strongest average result, while gpt-5.6-sol provided the strongest combination of analytical quality and repeatability.
For practical data-analysis workflows, this difference matters. A model that performs slightly better on average may still be less useful if its outputs vary substantially between runs.
A clear leading group
Three models form the leading group in the benchmark:
- gpt-5.6-sol, with a reliability-adjusted score of 0.46,
- claude-fable-5, with 0.42,
- gpt-5.5, with 0.30.
Gpt-5.5 achieved a mean score of 0.40. Although its result was clearly below the two leading models, it maintained a substantial advantage over the rest of the evaluated group.
The gap between the third- and fourth-ranked models is considerable. Claude-sonnet-5 and gemini-3.5-flash both achieved reliability-adjusted scores of 0.10.
The results therefore suggest a distinct top tier, followed by a group of models whose average analytical performance and repeatability were substantially lower in this benchmark.
Similar mean scores can lead to different adjusted results
The benchmark also shows why average scores alone can be misleading.
Claude-sonnet-5 and gpt-5.4 both achieved a mean score of 0.23. Their reliability-adjusted scores were different, however: 0.10 for claude-sonnet-5 and 0.07 for gpt-5.4.
This indicates that claude-sonnet-5 provided a stronger combination of average quality and consistency, despite both models reaching the same mean result.
Gemini-3.5-flash achieved a slightly higher mean score of 0.24 and a reliability-adjusted score of 0.10. It therefore matched claude-sonnet-5 after the reliability adjustment.
Gemini-3.1-pro-preview recorded a mean score of 0.21, but its adjusted score fell to 0.07, placing it alongside gpt-5.4.
These comparisons demonstrate that models with similar average performance may differ meaningfully in how reliably they reproduce that performance.
Lower average performance can still produce a better reliability ranking
Deepseek-reasoner achieved the lowest mean score in the benchmark, at 0.18. Despite this, its reliability-adjusted score of 0.09 placed it above gemini-3.1-pro-preview and gpt-5.4.
Both of those models achieved higher mean scores, at 0.21 and 0.23 respectively, but received adjusted scores of 0.07.
This means that deepseek-reasoner’s lower average analytical quality was accompanied by comparatively smaller instability. As a result, it ranked higher once repeatability was taken into account.
The example illustrates an important evaluation principle: a model’s usefulness is determined not only by how well it performs on average, but also by how predictably it reaches that level of performance.
How to read the results
The mean score estimates each model’s average analytical quality across the benchmark.
The interval shown in the mean-score chart represents one standard deviation calculated from the coefficient of variation. A wider interval indicates greater variation between repeated trajectories.
In practice, this means that the model may solve a task well in one run and produce a much weaker result in another.
The reliability-adjusted score combines the mean result with relative instability:
Reliability-adjusted score = ms × exp(-2.25 × CoV^0.88)
where:
- ms is the mean score,
- CoV is the coefficient of variation across repeated trajectories.
The score is bounded between 0 and 1. Higher values indicate a stronger combination of analytical quality and repeatability.
Evaluation setup
The complete EDA Benchmark methodology, public tasks, configuration, outputs, and evaluation artifacts are available in the project repository https://github.com/deepsense-ai/eda-benchmark.
Custom synthetic datasets and evaluation environments
EDA Benchmark is a public example of the synthetic data and evaluation work developed at deepsense.ai.
We create custom datasets, task generators, benchmarks, and simulation environments for AI labs developing LLMs, VLMs, and agentic systems.

Table of contents