
HE plots
GPS helps the drivers to avoid traffic jams, yet in more advanced uses it allows for fleet management or remote drone strikes. It is just the same with visualization. Bars and dots can be used to present a set of several means but there are also more advanced uses such as presentation of differences in the covariance structures. And it’s today’s topic. But first things first.
I have recently faced the following problem (field of science: anthropology). We have skulls, both female and male, found in different places. Each skull is described by five numbers specifying distances between particular elements of the skull. What question do we want to answer? We want to test whether and to what extent the parameters are different for female and male skulls and for the skulls found in various locations.
If parameters of the skulls were expressed by one number instead of five we could solve the puzzle using a classic two-way analysis of variance.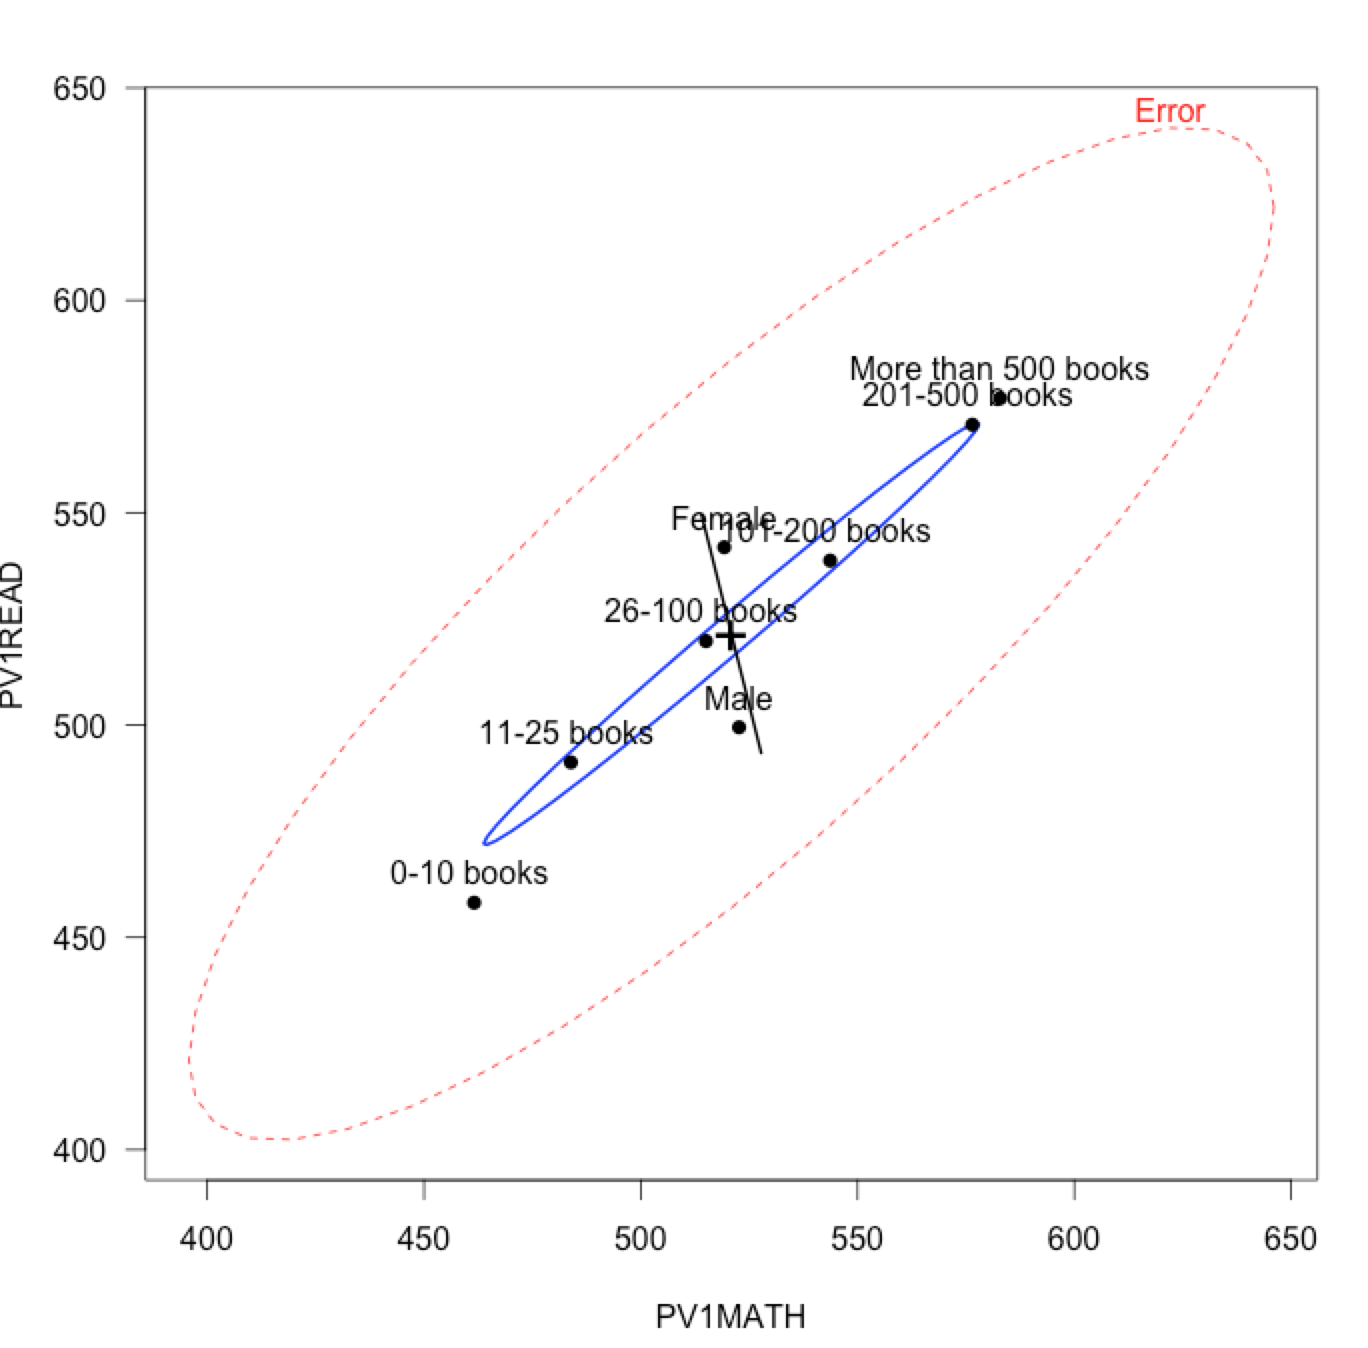 Having five parameters describing the skulls, we can approach each of them individually and solve the problem by performing five separate analysis of variances.
However, our parameters are interdependent and in this case we will get much better results if we employ models allowing for simultaneous modeling of multidimensional variables.
We face the problem of simultaneous modeling of multidimensional measurements quite often, especially when the variables we try to present are interdependent. This is the case for example during simultaneous modeling of skills (e.g. in education, measured in few subdomains like math, reading, science), financial products (prepossession vs. risk) or in industry like modeling of the amount of milk, protein and fat in the milk yield.
Is there scope for interesting plots? Let us see.
We will start from taking a quick look at the one-dimensional problem.
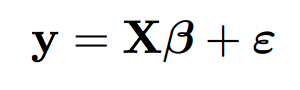
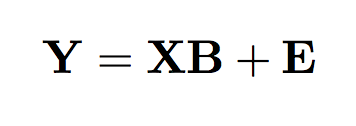
The standard linear model with one-dimensional response is usually as follows:
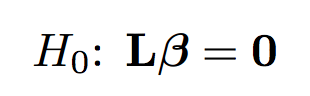
The null hypothesis in a general form can be written in the following way (L is a contrast matrix):
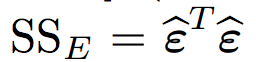
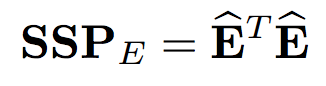
The test for such hypothesis is based on the quotient of two estimates. One of them is a estimate of the size of random noise
and the other one is the estimate of the size of effect
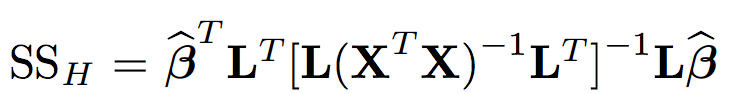
After scaling such quotient has distribution F. If the effect is considerably bigger than the distortion we consider this effect really significant. That’s it.
But how about multidimensional models?
Firstly, effect Y is multidimensional and as a result the effects are described by the coefficient matrix and the vector of random noise is also multidimensional.
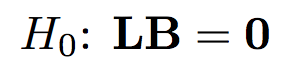
The hypothesis is constructed in a very similar way. The only difference is that zero on the right side of the equation is a matrix.
Now we have reached the test phase. We proceed in the same way as in case of one-dimensional model. Firstly, we calculate the size of the effect (also sometimes called effect Hypothesis, whence H standing for hypothesis) and the scope of random noise (E for error). Now these values are symmetric matrices.

Once we have such a pair of matrices we have to face the following question: when is the matrix for effect considerably bigger than the matrix for random noise?
There are several approaches to this question but they usually come down to the analysis of the distance between the effect matrix times inverse of the error matrix and the unit matrix (in case of the null hypothesis the distance should be insignificant).
One can do this using characteristic values etc.
However, one can also visually compare these two matrices, e.g. on a plot! This is what HE plots are for.
In R program you will find tools for creation of HE plots in the heplots package. Let us see how to use them on an example.
Data on the skulls are not publicly available, so let us take as an example data from PISA study on levels of skills in three fields: mathematics, science and reading. We will check the influence of two factors, gender and numbers of books at home, on this three-dimensional vector.
Let’s go to R! We load the package and select only the data concerning Poland. Then we build a three-dimensional linear model and we draw a HE plots for it.
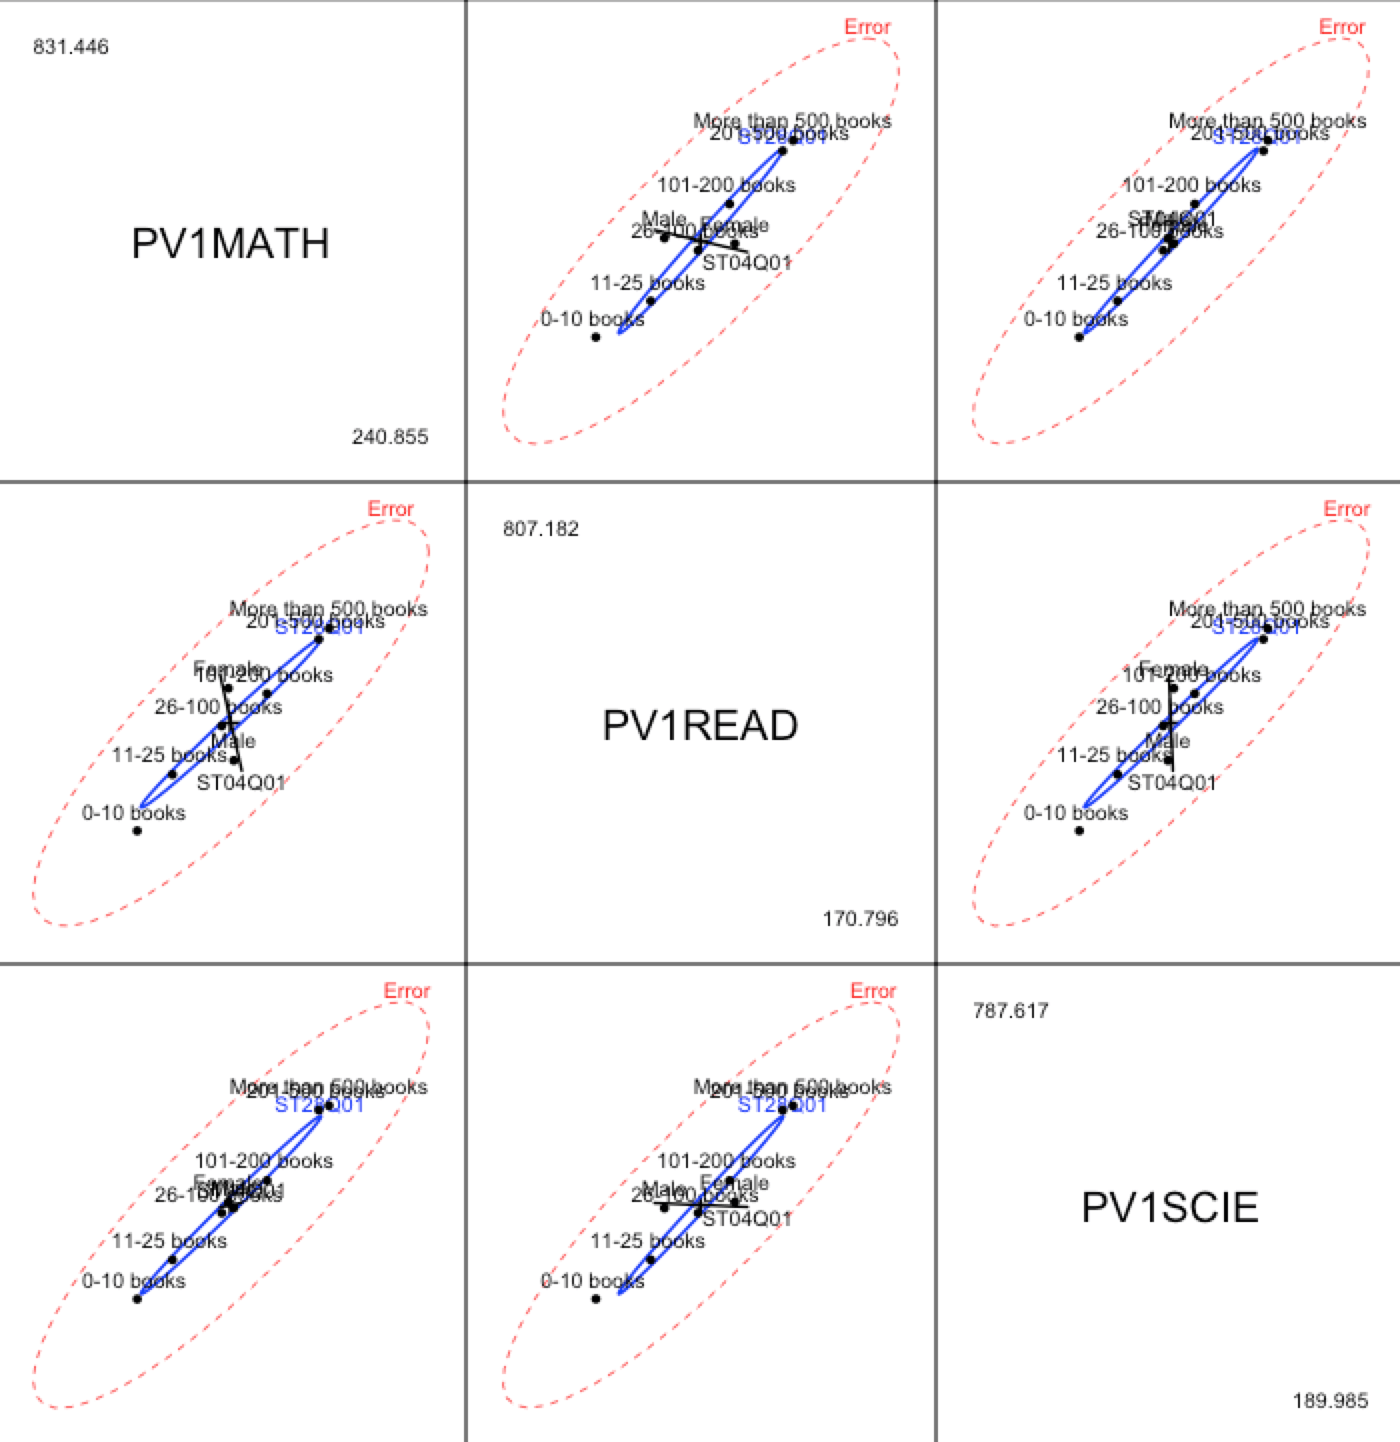
library(PISA2012lite)
pol = student2012[student2012$CNT == "Poland",]
model = lm(cbind(PV1MATH, PV1READ, PV1SCIE)~ST28Q01+ST04Q01, pol)
heplot(model, size="effect.size", las=1, term.labels=F)
Interestingly, the moment we look at this diagram we come to at least three conclusions:
(i) results in mathematics and reading comprehension are correlated in the residuals,
(ii) effect produced by books is rather strong and it is correlated both with the results in mathematics and reading,
(iii) effect produced by gender is also strong but its nature is different; females’ results in reading comprehension are on average much better while their average results in mathematics are a little worse.
All the relationships presented on one plot.
This is a diagram presenting matrices H and E for the pair of variables. We can display all the pairs using the pairs() function.
But what should we do when the variables are very numerous? Instead of generating dozens of diagrams we would like to present the most important information on one diagram which would sum up all the variables. In such case we might use canonical discriminant analyses which will be a topic of the next week’s post.
More information about HE plots is available:
Visual Hypothesis Tests in Multivariate Linear Models: The heplots Package for R
John Fox Michael Friendly Georges Monette
HE Plots for Multivariate Linear Models
Michael Friendly
HE Plots for Repeated Measures Designs
Michael Friendly
Przemyslaw Biecek