Table of contents
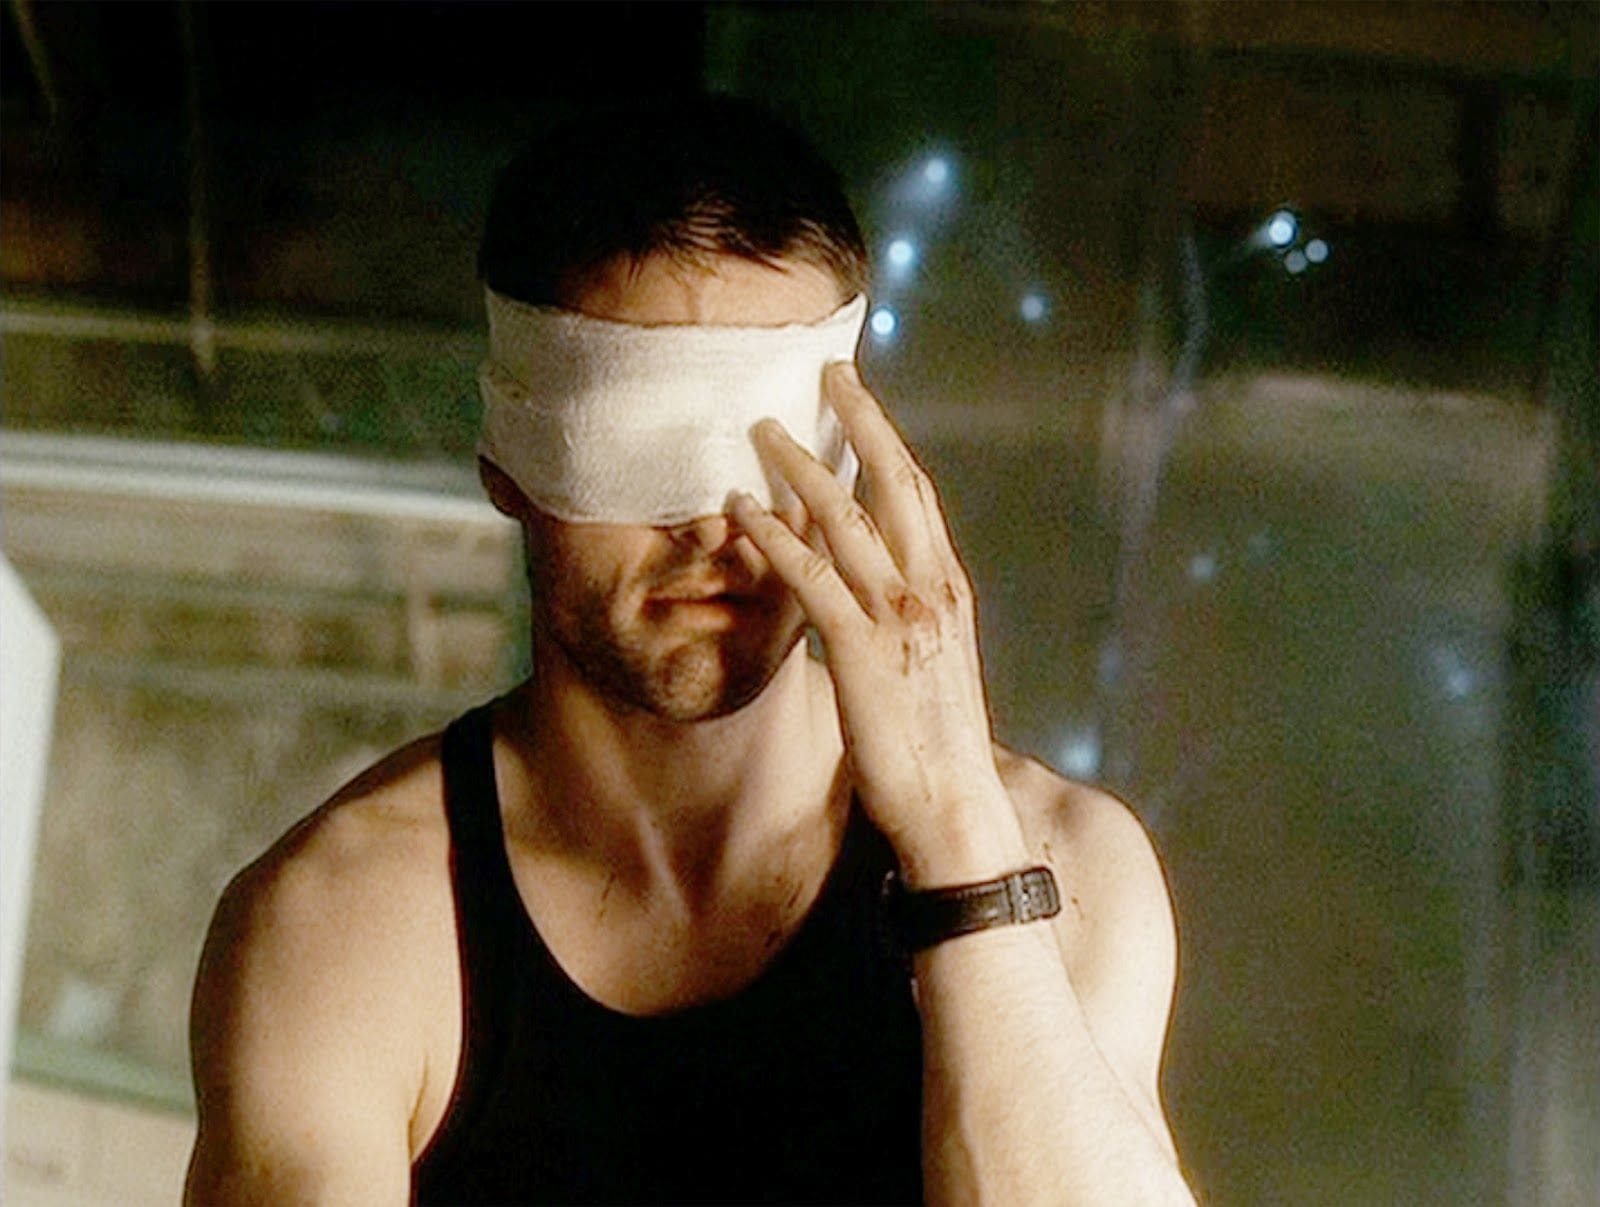
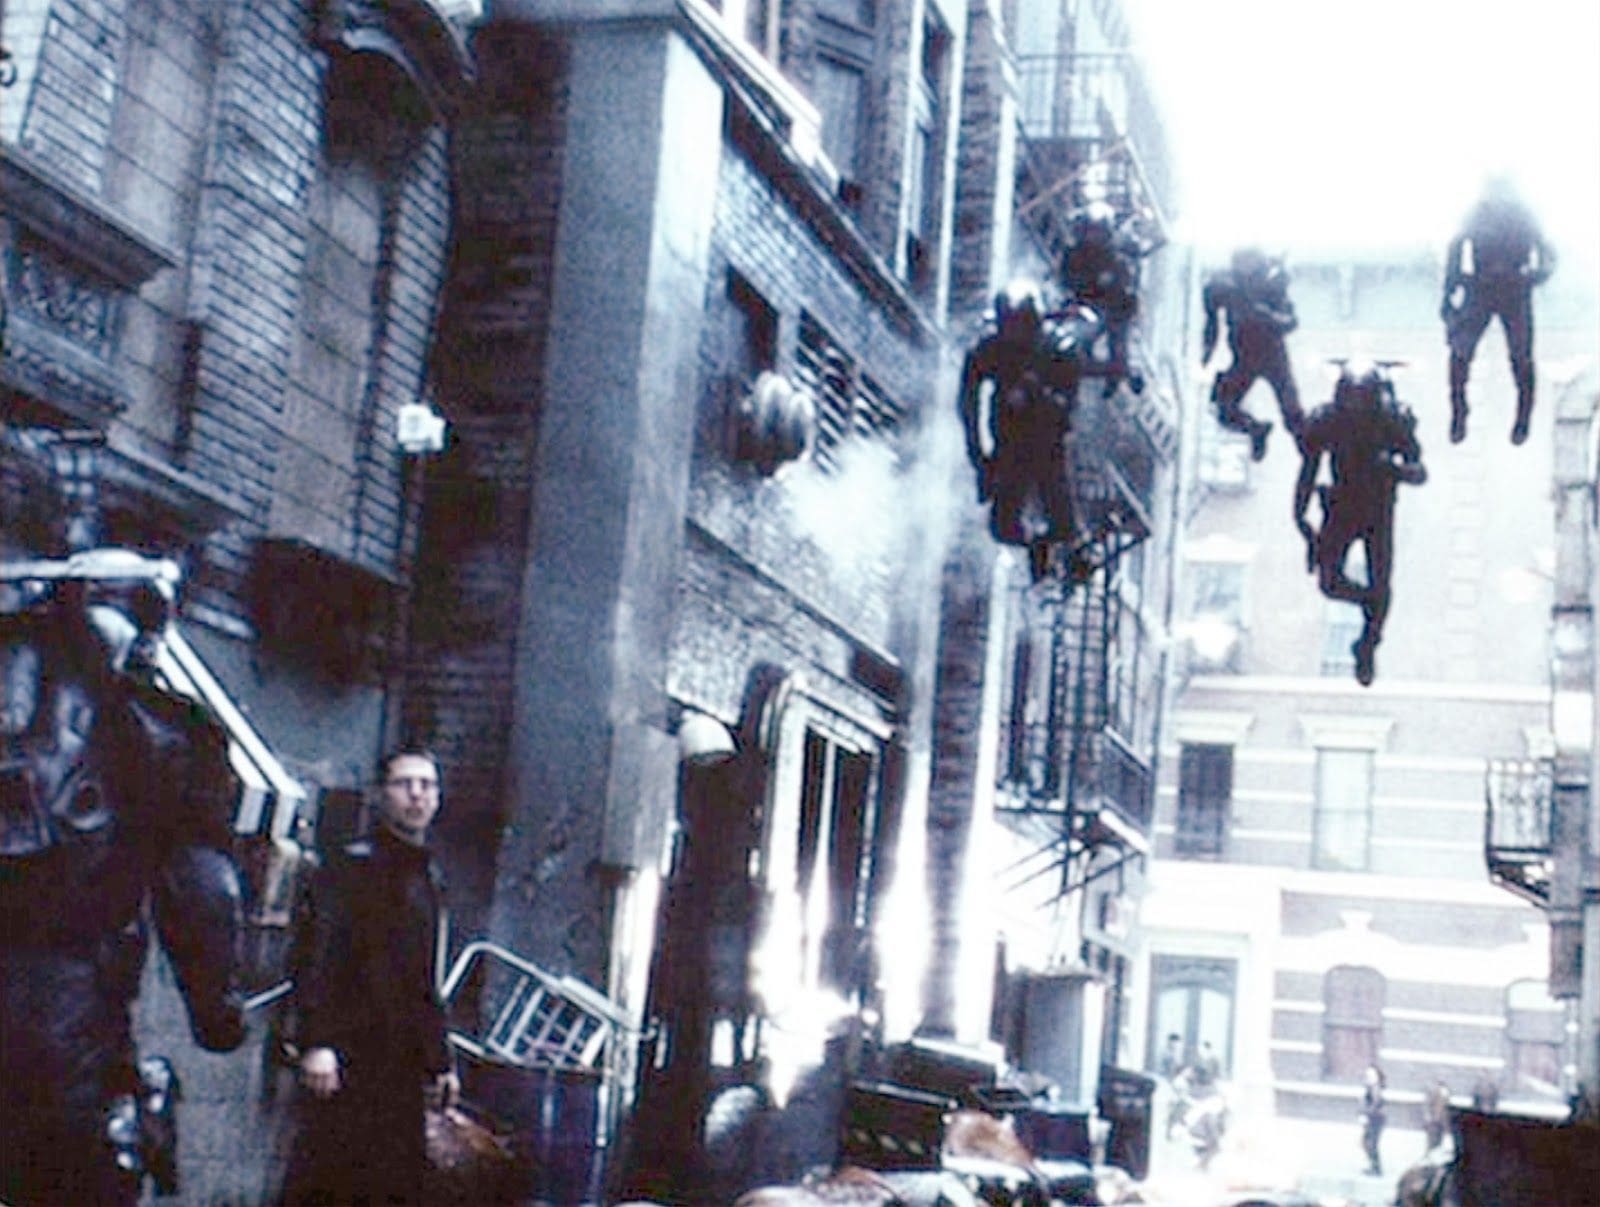
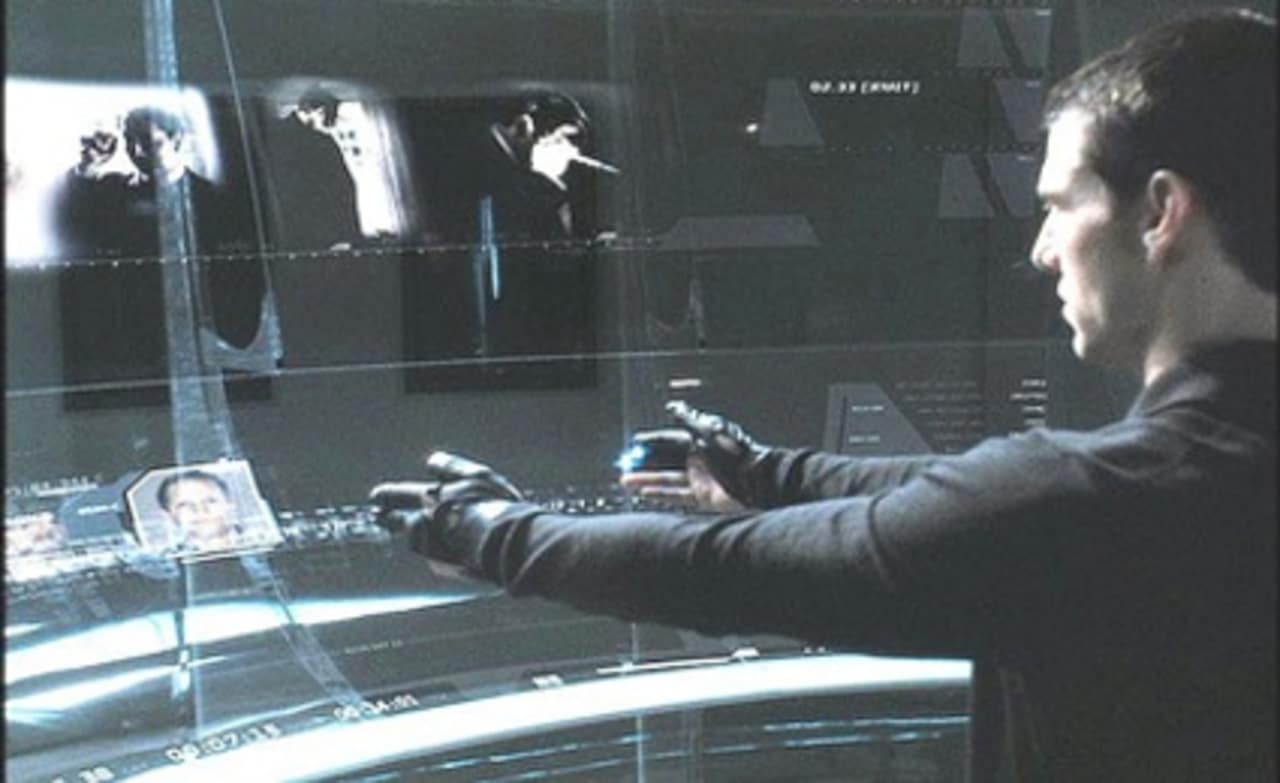
Everybody who watched ‘Minority Report’, Steven Spielberg’s movie based on the Philip Dick’s short story, daydreams about crime forecasting in the real world. We have good news: machine learning algorithms can do just that!
Table of contents
In September 2016, the National Institute of Justice in the US announced the Real-Time Crime Forecasting Challenge. The goal was to predict future crimes in the city of Portland, OR. CodiLime, deepsense.ai’s parent company, took part in it, giving the job to our machine learning team. The results were revealed in August 2017: we did a great job and won eight out of 40 sub-competitions! In this post we describe the crime forecasting algorithms we used.
Competition rules
Fortunately, the NIJ didn’t ask contestants to carve names of forthcoming criminals and victims into wooden balls, as was the case in the movie. Instead, they wanted to know the hotspots – small areas with the greatest ‘intensity’ of future crimes.

Three different types of crimes were considered separately: burglary, car theft and street crimes (including assaults, robberies, shots fired). Additionally, all the crimes together were of interest as well. The end of February 2017 was the deadline and five future timespans were involved:
- The first week of March 2017,
- The first two weeks of March 2017,
- All of March 2017,
- March and April 2017,
- March, April and May 2017.
Thus, we had to make 4 x 5 = 20 individual crime forecasts for 20 type/time categories (e.g. ‘burglary, two weeks’). Once we finished May 2017, in each of 20 type/time categories our hotspot predictions were compared against the actual state of affairs in Portland using two independent metrics:
- ‘crime density’: number of crimes that occurred in hotspots divided by the total volume of hotspots,
- ‘prediction efficiency’: the number of crimes that occurred in hotspots divided by the number of crimes in the actual worst regions with the same total volume as our hotspots.
Hence, the competition consisted of 4 x 5 x 2 = 40 separate sub-competitions in total (e.g. ‘burglary, two weeks, crime density’). The winner took it all in each of them and the all was $15,000. So, there was $600,000 in the pot – a good motivation to work!
To be clear, three independent clones of the Real-Time Crime Forecasting Challenge were run simultaneously. The one we took part in was intended for large businesses. Of the remaining two, one was run for small businesses and the other for students. Every clone had the same rules and goals, but its own contestants, winners and prizes.
Our solution
Data
In ‘Minority Report’, the Precrime Police unit got their crime forecasts from Precogs, three mutated humans who could see into the future. At deepsense.ai, our Precrime unit created the predictions based on the past.

The organizer delivered historical data with all the crimes registered in Portland between March 2012 and February 2017. Almost 1,000,000 records were provided in total. Each of them contained daytime, place (with accuracy to one foot!) and the type of crime committed.
Our first question was: since we have no Precogs onboard, can we use anything else than historical data? What could affect future crimes, but hadn’t left a trace on those that had already been committed? Well, in our opinion these could only be future events. But are they easier to predict than crimes themselves? For instance, one can page through local newspapers seeking sentences like ‘A new gin mill is going to be opened in March 2017. The crime rate will certainly rise there.’ However, such research requires a lot of work and there is no guarantee it’ll actually help. So we decided to squeeze as much out of the historical data only as we could.
Blind contest
No leaderboard was run during the contest. We didn’t know how many competitors we had and how honed their crime forecasting skills were. The only thing we could do to win was improve our own results over and over.
The first attempts showed us that in each of 20 type/time categories the ‘crime density’ metric was maximized by a lot of small hotspots whereas the ‘prediction efficiency’ performed best for a small number of large hotspots. Hence it was clear that we couldn’t satisfy both metrics simultaneously. Since each metric formed an independent sub-competition with a separate prize, it was better to have a good score for one metric than mediocre results for both. So, for each of the 20 type/time categories we had to decide which metric to focus on in our further work.
Which metric to choose when the metrics are incomparable, scores between categories are incomparable and you don’t know other competitors’ results? We checked that under some reasonable assumptions the best strategy is to just toss a coin; and this is what we did, 20 times – once per type/time category.
Bad neighborhoods remain bad
The major rule we followed while building our models was rather pessimistic: ‘if many crimes have occurred somewhere, more are likely to happen.’ This principle may strike some as naive, but the longer we explored the data, the more confident we were that it worked.
Not every past crime is equally important. We took advantage of the aging and seasonality of data. We focused more on data from 2017 and 2016 than on older ones. Also, we boosted the significance of crimes committed in the same season as the forecasting time. For instance, to make predictions for March 2017 we took special care of data from preceding Marches. Moreover, as we know, evil is prone to ‘radiate’. When a crime is committed, we can expect others to happen nearby. This is why we decided to ‘diffuse’ the data points. For those who like statistical jargon, we note that this technique is called kernel density estimation.
However, we didn’t set the ‘intensities’ of data aging, seasonality and diffusion by hand. They were adjusted by our algorithm automatically. How did it know how to do that, you ask? As always in machine learning, it just chose them to obtain the best results! For each of 20 type/time categories we separated the last period of historical data as a validation dataset (e.g. February 2017 for a forecasting of March 2017). The algorithm used all but validation data to check which parameters best predict crimes from the validation set. Then, ultimately, it took all the available data to prepare the final crime forecasting.
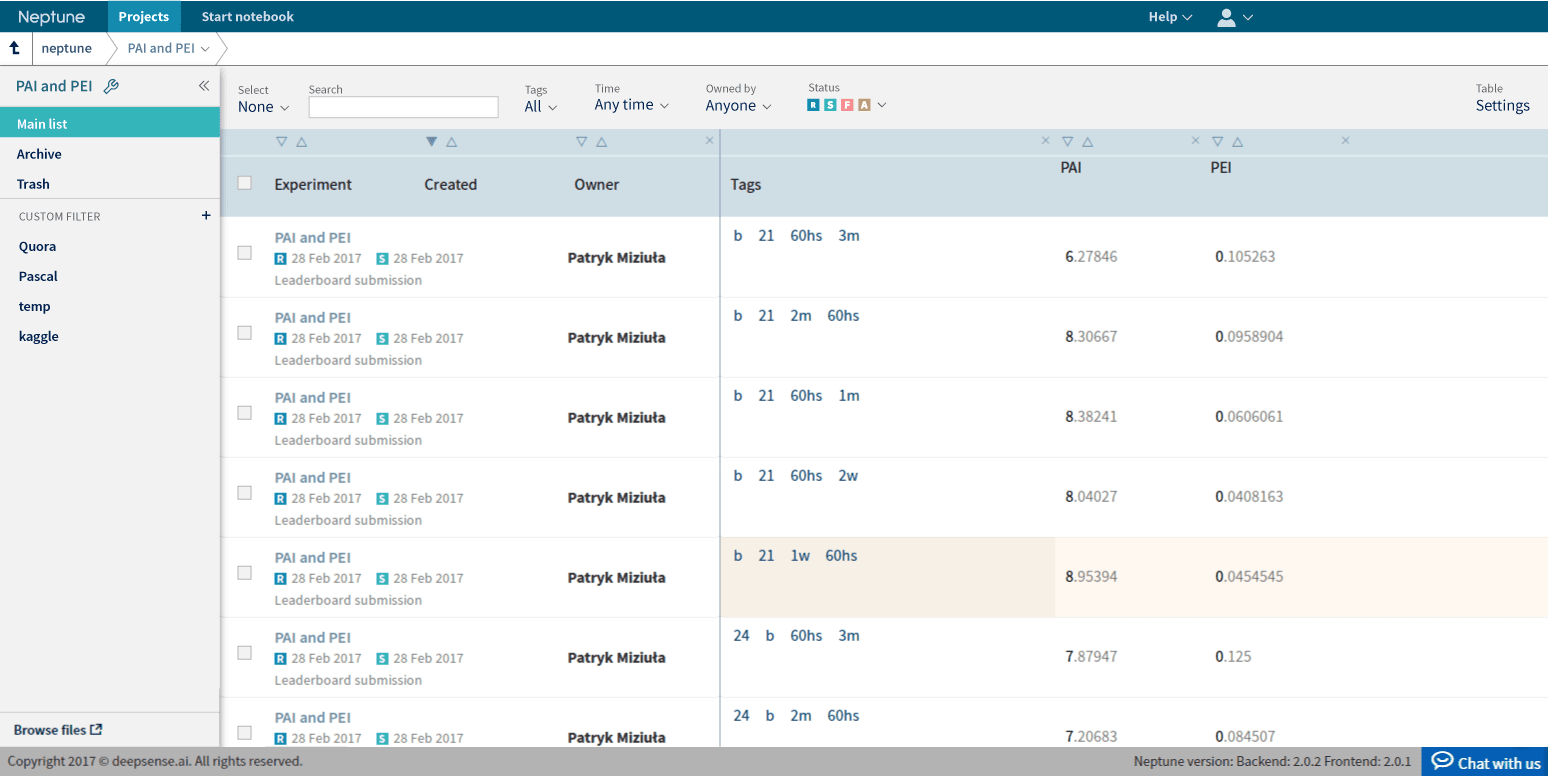
Neptune
We must say that the Real-Time Crime Forecasting Challenge was also a logistic challenge. We had to manage and improve 40 models simultaneously. To do that we used our own machine learning lab called Neptune. We designed it for precisely this type of task: to easily store, compare and recreate a lot of experiments. To be honest, we can’t imagine how one would handle 40 models without using this tool.
Results
The results were announced in August 2017: in our large-business group we won 8 out of 40 sub-competitions, were the runner-up in 6 more and took third place in yet another 6. This is a big success, but there is something we are especially proud of. We compared crime forecasts from all the three clones of the competition: large businesses, small businesses and students, and it turned out that our results would give us the top place in the total ranking! Our team finished with the best predictions in seven sub-competitions, three more that the runner-up managed.
Do you want to see one of our winning crime forecasts? Here it is:
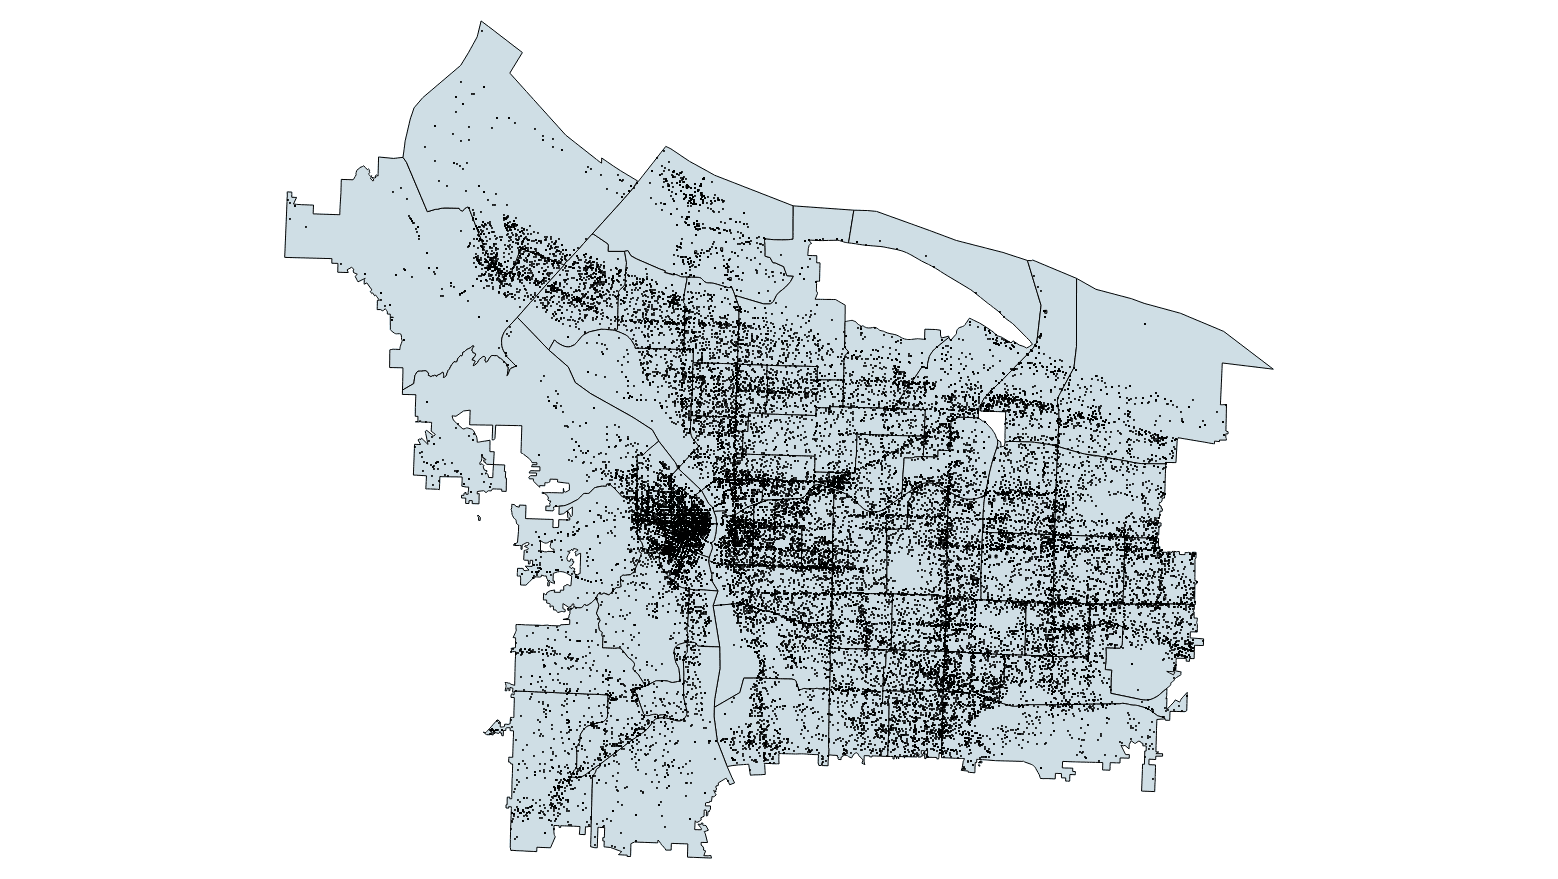
The gray area is Portland, around 15 by 20 miles. 56,000 black dots are all the crimes committed between March and May 2017. The hotspots we chose are blue, but you probably can’t see them, so let’s zoom in on the Downtown:
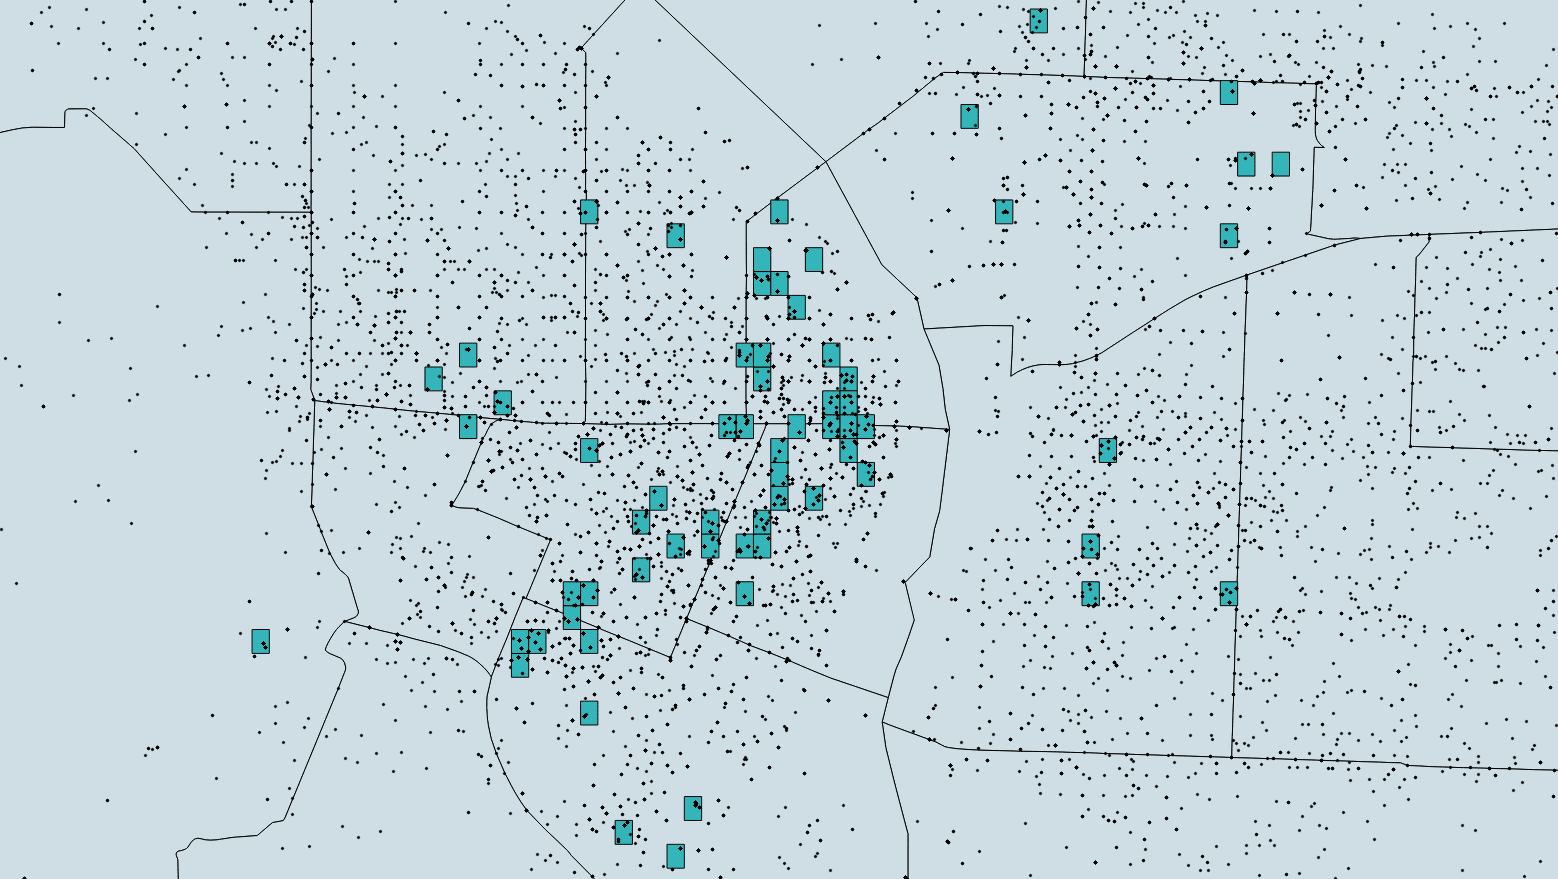
We indicated 112 hotspots, 294 by 213 ft each. They appear to be placed randomly, but they are not, they lie optimally. This is why machine learning algorithms are so fun: it’s hard to deal with their outputs using common sense, but they work!
Needle in a haystack
The total number of crimes in Portland between March and May 2017 – 56,000 – is impressively big. Another category was on the opposite pole: during the first week of March 2017 only 20 (twenty) burglaries were committed in the investigated area!
If you think that it is hard to shoot 20 random events in a 150 mi2 area with use of bars with the total volume less than ¾ mi2 (the organizer’s requirement), you are absolutely right. In our opinion it was a matter of luck. We indeed hit one burglary, but it wasn’t enough to win this category. But there was another way.
The number of 20 crimes is so small that hypothetically any cheater could simply change the history and assure his victory by arranging a burglary or two in fixed places. Of course we didn’t do that and we think that nobody did since 20-25 is a typical amount of weekly burglaries in Portland. Experienced data scientists wouldn’t try this hoax because they’d know that if they weren’t the only ones who were going to do so, they wouldn’t benefit from this highly risky move. And, above all, they tend to spend their time on doing data science stuff rather than plotting fake crimes – being honest is usually a simpler way for us. However, in the ‘Minority Report’ universe a wooden ball would inform us about any bad intentions. In our world we just believe in people… or we can predict their behavior using machine learning algorithms!
Summary
If you’ve enjoyed our post or want to ask about anything related to crime forecasting (or maybe demand forecasting?), please leave us a reply!