Logo detection and brand visibility analytics – example
Companies pay astonishing amounts of money to sponsor events and raise brand visibility. Calculating the ROI from such sponsorship can be augmented with machine learning-powered tools to deliver more accurate results.
Event sponsoring is a well-established marketing strategy to build brand awareness. Despite being one of the most recognizable brands in the automotive industry, Chevrolet pays $71.4 million dollars each year to put its brand on Manchester United shirts.
How many people does your brand reach?
According to Eventmarketer’s study, 72% of consumers positively view brands that provide them with positive experiences, be it a great sports game or another cultural event, such as a music festival. Such events attract large numbers of viewers both directly and via media reports, allowing brands to get favorable positioning and work on their word-of-mouth recognition.
Sponsorship contracts often come at a steep price, so brand owners are naturally more than a little interested in finding out how effectively their outlays are working for them. However, it’s difficult to assess quantitatively just how great the brand exposure is in a given campaign. The information on brand exposure can further support demand forecasting efforts, as the company gains information on expected demand peaks that result from greater brand exposure in media coverage.
The current approach to computing such statistics has involved manually annotating broadcast material, which is tedious and expensive. To address these problems, we have developed an automated tool for logo detection and visibility analysis that provides both raw detection and a rich set of statistics.
Solution overview
We decided to break the problem down into two steps: logo detection with convolutional neural networks and an analytics for computing summary statistics.

The main advantage of this approach is that swapping the analytics module for a different one is straightforward. This is essential when different types of statistics are called for, or even if the neural net is to be trained for a completely different task (we had plenty of fun modifying this system to spot and count coins – stay tuned for a future blog post on that).
Logo detection with deep learning
There are two principal approaches to object detection with convolutional neural networks: region-based methods and fully convolutional methods.
Region-based methods, such as R-CNN and its descendants, first identify image regions which are likely to contain objects (region proposals). They then extract these regions and process them individually with an image classifier. This process tends to be quite slow, but can be sped up to some extent with Fast R-CNN, where the image is processed by the convolutional network as a whole and then region representations are extracted from high-level feature maps. Faster R-CNN is a further improvement where region proposals are also computed from high-level CNN features, which accelerates the region proposal step.
Fully convolutional methods, such as SSD, do away with processing individual region proposals and instead aim to output class labels where the region proposal step would be. This approach can be much faster, since there is no need to extract and process region proposals individually. In order to make this work for objects with very different sizes, the SSD network has several detection layers attached to feature maps of different resolutions.
Since real-time video processing is one of the requirements of our system, we decided to go with the SSD method rather than Fast R-CNN. Our network also uses ResNet-50 as its convnet backbone, rather than the default VGG-16. This made it much less memory-hungry, while also helping to stabilize the training process.
Model training
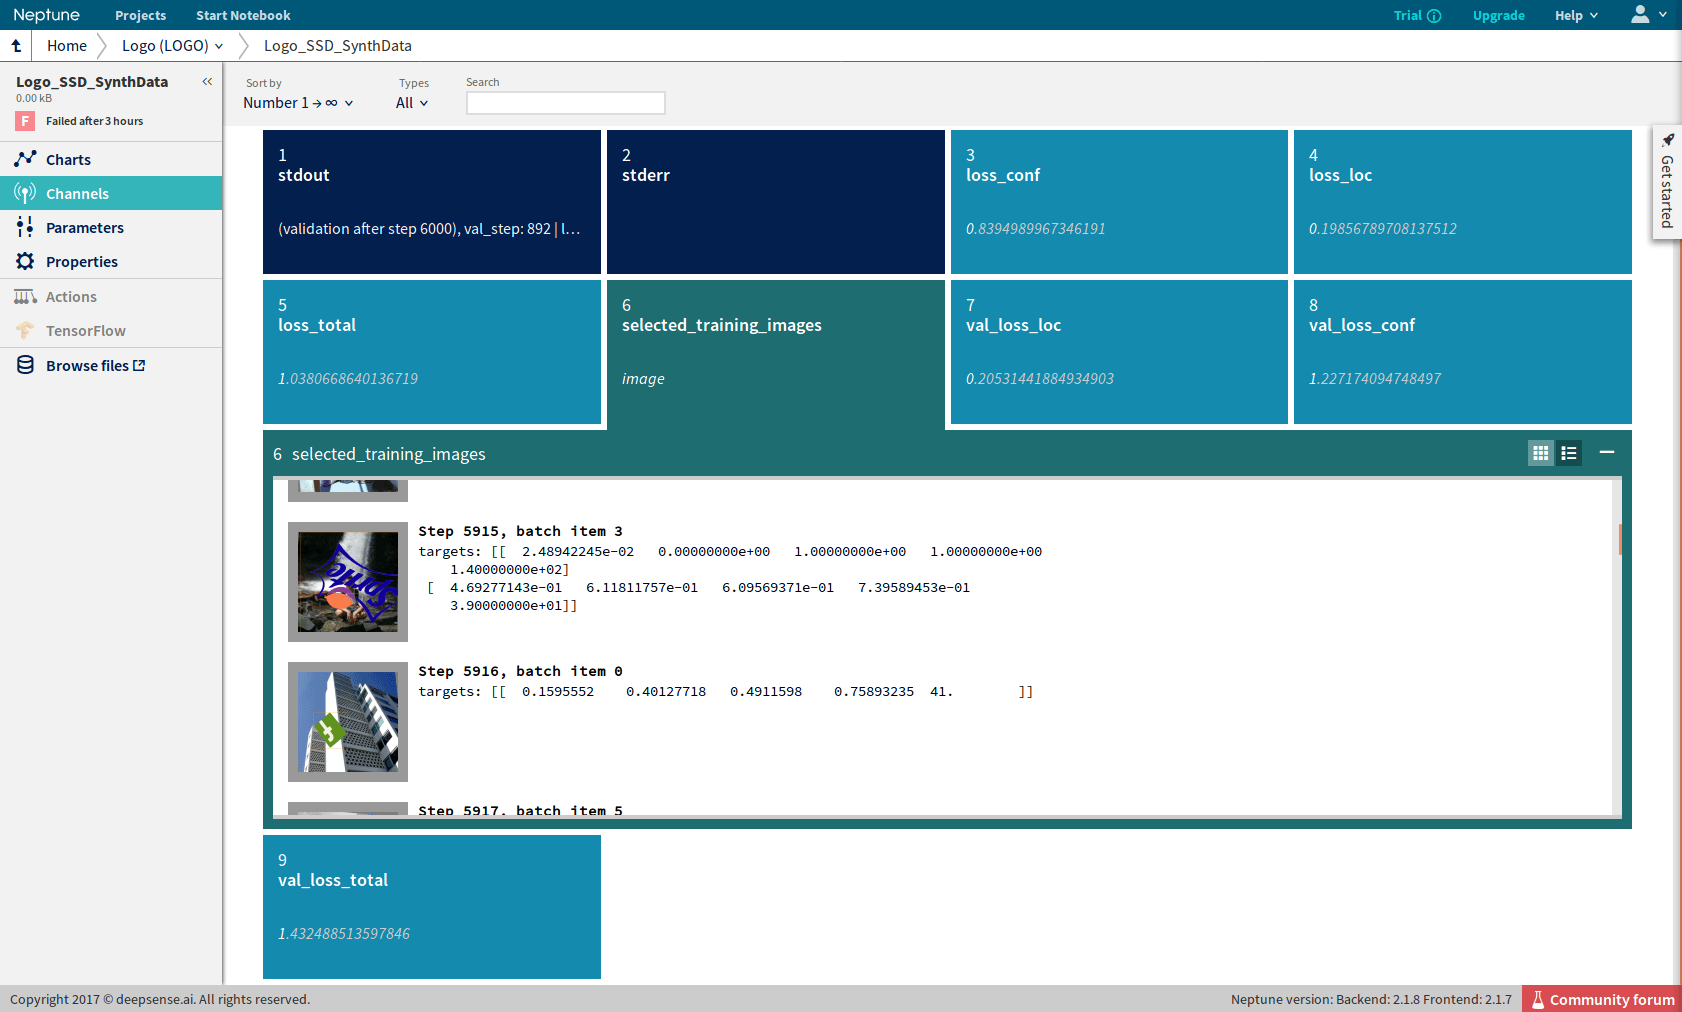
In the process of refining the SSD architecture for our requirements, we ran dozens of experiments. This was an iterative process with a large delay between the start and finish of an experiment (typically 1-2 days). In order to run numerous experiments in parallel, we used Neptune, our machine learning experiment manager. Neptune captures the values of the loss function and other statistics while an experiment is running, displaying them in a friendly web UI. Additionally, it can capture images via image channels and display them, which really helped us troubleshoot the different variations of the data augmentation we tested.

Logo detection analytics
The model we produced generates detections very well. However, when even a short video is analyzed, the raw description can span thousands of lines. To help humans analyze the results, we created software that translates these descriptions into a series of statistics, charts, rankings and visualizations that can be assembled into a concise report.
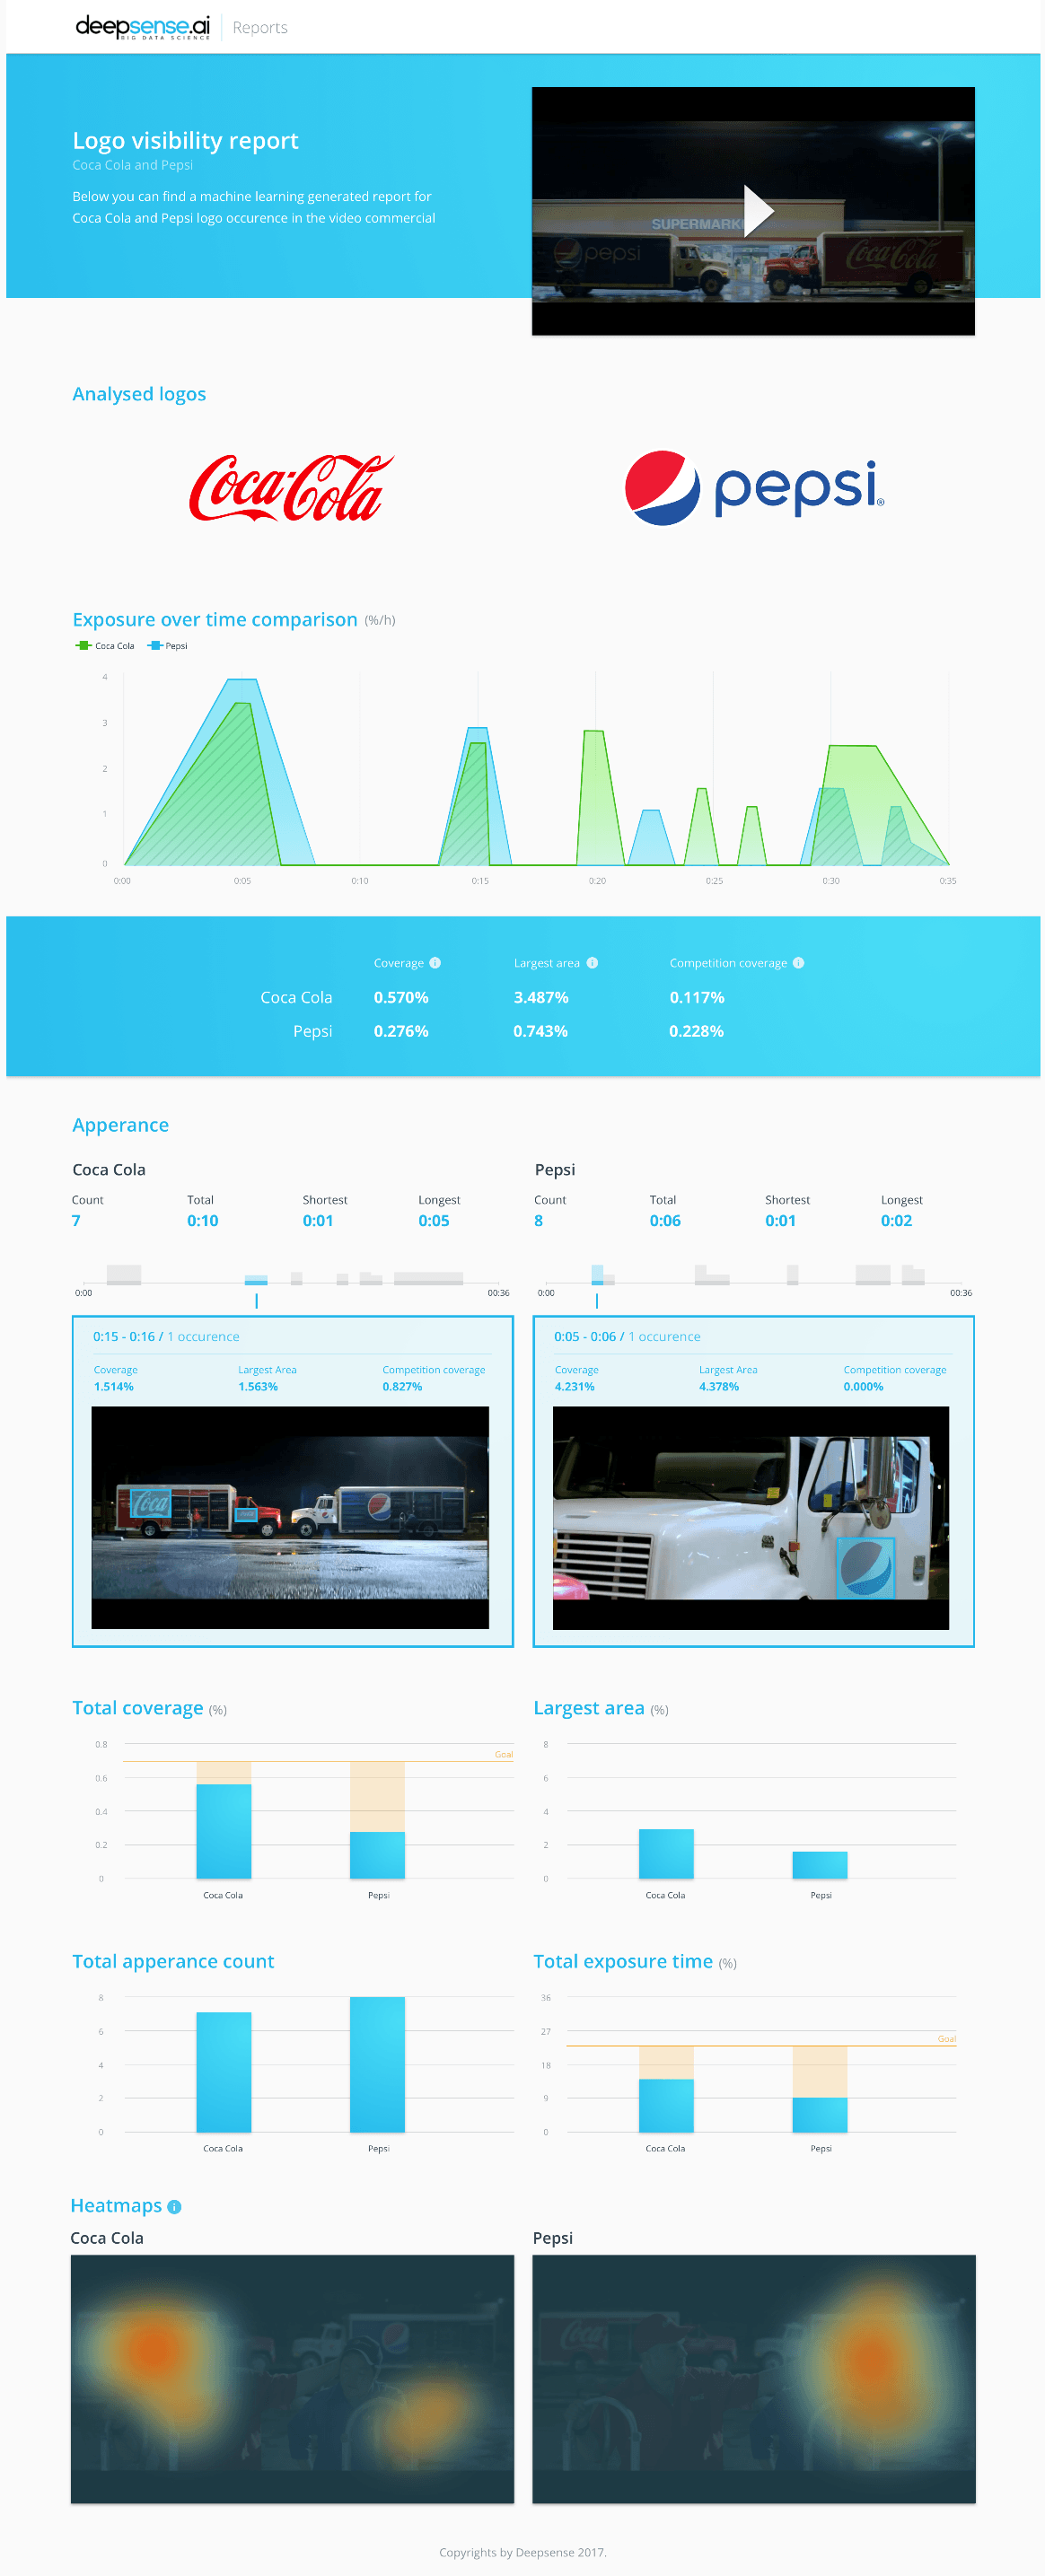
The statistics are calculated globally and per brand. Some of them, like brand display time, are meant to be displayed, but many are there to fuel the visual representation. Speaking of which, the charts are really expressive in this task. Some features include brand exposure size in time, heatmaps of a logo’s position on the screen and bar charts to allow you to easily compare various statistics across the brands. Last but not least, we have a module for creating highlights – visualizations of the bounding boxes detected by the model. This module serves a double purpose: in addition to making the analysis easy to track, such visualizations are also a source of valuable information for data scientists tweaking the model.
Results
We processed a short video featuring a competition between rivals Coca-Cola and Pepsi to see which brand received more exposure in quantitative terms. You can watch it on YouTube by following this link. Which logo has better visibility?
Below, you can compare your guesses with what our model reported:
Possible extensions
There are many business problems where object detection can be helpful. Here at deepsense.ai, we have worked on a number of them.
We developed a solution for Nielsen that extracts information about ingredients from photographs of FMCG products, using object detection networks to locate the list of ingredients in photographs of products. This made Nielsen’s data collection more efficient and automatic. In its bid to save the gravely endangered North Atlantic Right Whale,The NOAA used a related technique to spot whales in aerial photographs. Similar techniques are used when the reinforcement learning-based models behind autonomous vehicles learn to recognize road signs.
With logo detection technology, companies can evaluate a campaign’s ROI by analyzing any media coverage of a sponsored event. With the information on brand positioning in hand, it is easy to calculate the advertising equivalent value or determine the most impactful events to sponsor.
With further extrapolation, companies can monitor the context of media coverage and track whether their brand is shown with positive or negative information, providing even more knowledge for the marketing team.


