Table of contents
Getting the right answer once is easy, but getting it every time is what real data-analysis work demands.
The latest EDA Benchmark round brings a new generation of models to the top. claude-opus-5-5 now leads, but the bigger story is that a model’s average score still says little about whether it will give you the same quality of answer twice.A text-generation model gives you an answer to inspect. An agent can issue a refund, update a ticket, or write to the system of record. Before you let it act, you need evidence not only that it can reach the right outcome, but that it can do so repeatedly, within the right boundaries, and at an acceptable cost.
What is EDA Benchmark?
EDA Benchmark is an open evaluation of how well Large Language Models and agentic systems perform Exploratory Data Analysis tasks when both accuracy and repeatability matter.
It is designed for teams assessing whether AI models can be trusted in real data-analysis workflows. These workflows require models to inspect files, clean inconsistent records, combine data sources, detect anomalies, reconstruct events, and return structured results.
The benchmark includes 10 synthetic data-analysis tasks spanning diverse domains. Each model completes every task five times, allowing us to evaluate both answer quality and performance consistency across 50 trajectories in total.
Models are compared using two complementary measures:
- mean score, representing average analytical performance;
- reliability-adjusted score, rewarding models that consistently produce strong results across repeated executions.
The results again show an important distinction between analytical accuracy and dependable execution.
claude-fable-5: progress since the previous measurement
In the previous update, the leader in reliability-adjusted score was gpt-5.6-sol with 0.46, followed by claude-fable-5 with 0.42, and then gpt-5.5 with 0.30. The remaining models formed a clearly lower group: claude-sonnet-5 and gemini-3.5-flash at 0.10, deepseek-reasoner at 0.09, gemini-3.1-pro-preview and gpt-5.4 at 0.07. The highest mean score, 0.50, was held by claude-fable-5, with gpt-5.6-sol at 0.48.
Previous results from July 26
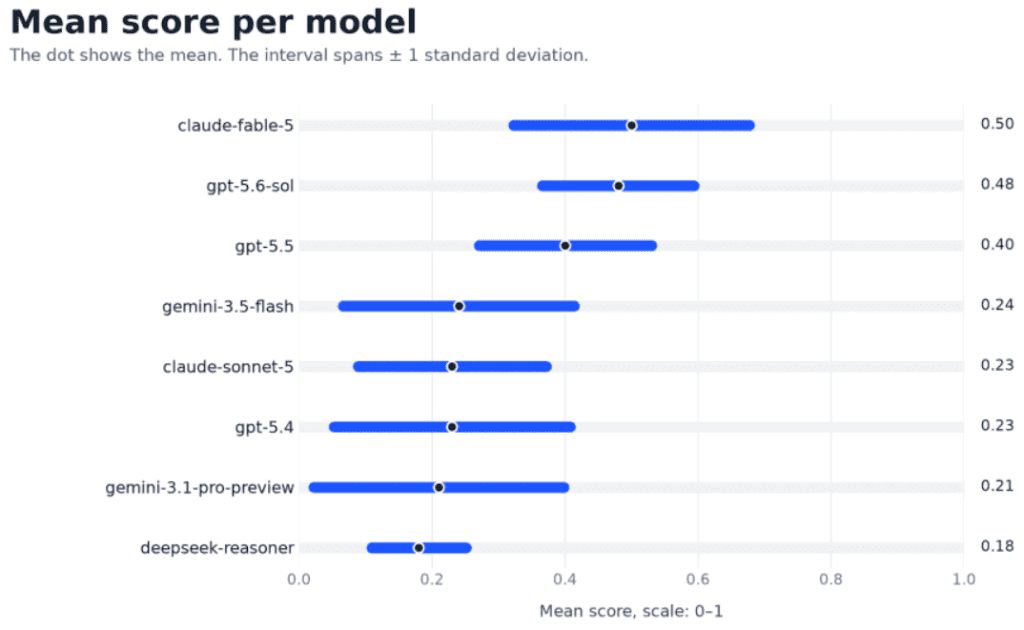
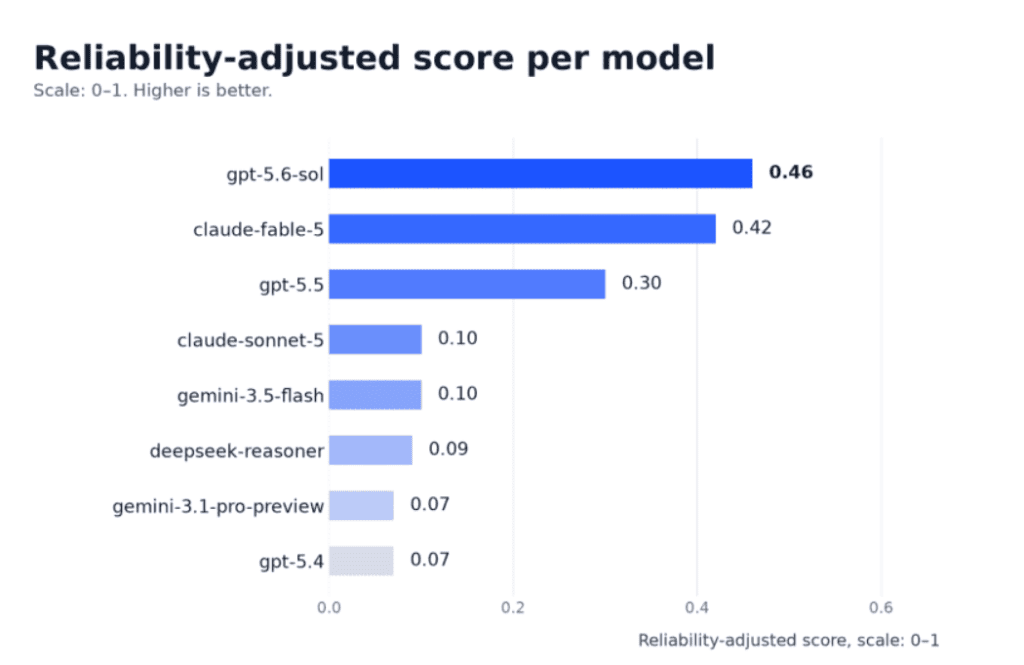
Models from the previous measurement were not re-tested. We kept their results in the ranking as a reference point. In this new round, we added newer models that show clear progress across the field.
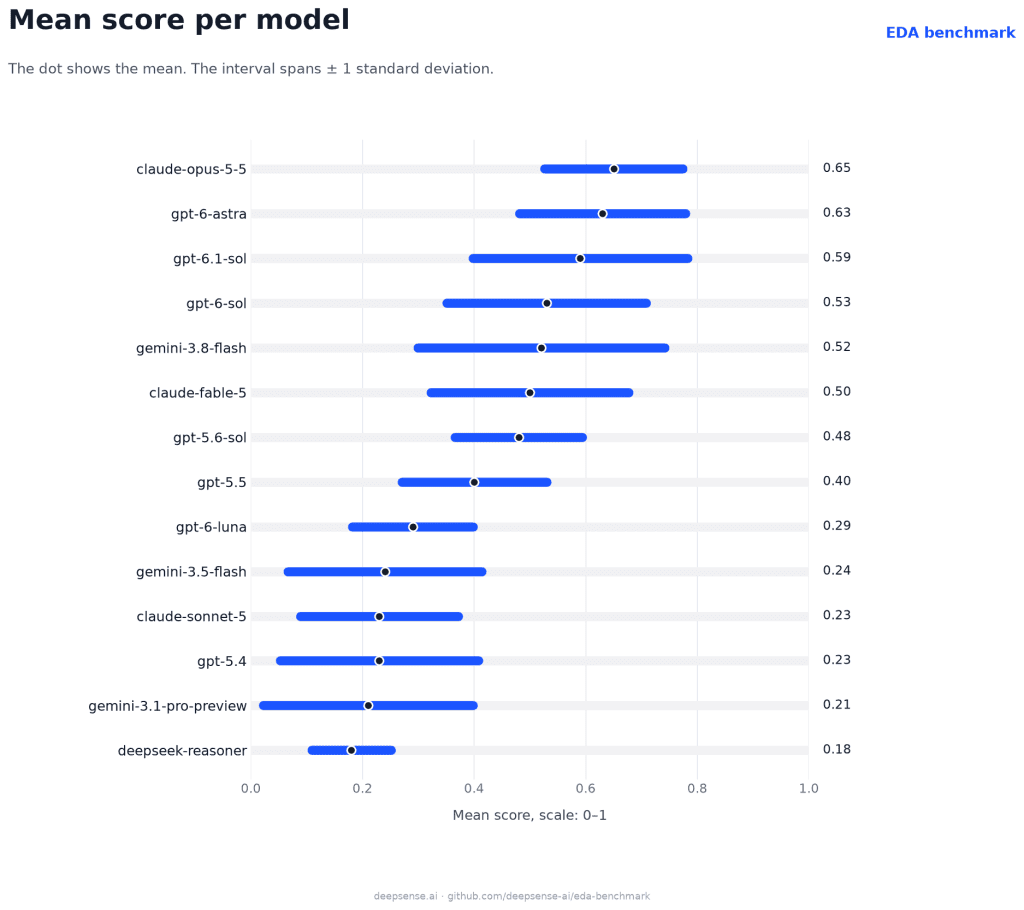
The new leader is claude-opus-5-5. It achieves a reliability-adjusted score of 0.62 and a mean score of 0.65. That is an increase of more than 0.16 points over the previous leader and 0.15 points over the previous best mean.
Right behind it is gpt-6-astra with a reliability-adjusted score of 0.55 and a mean of 0.63. Next are gpt-6.1-sol at 0.46 and 0.59 and gpt-6-sol at 0.43 and 0.53.
It is worth seeing where the models from the previous edition land. gpt-5.6-sol, the former reliability leader, keeps its 0.46 score, but in the new set it now shares 3rd-4th place with gpt-6.1-sol. claude-fable-5 remains at 0.42, now tied with gemini-3.8-flash, and gpt-5.5 at 0.30 still outranks the rest of the old group.
A new leading group: claude-opus-5-5
Three models form a distinct new elite:
- claude-opus-5-5, reliability-adjusted 0.62, mean 0.65
- gpt-6-astra, reliability-adjusted 0.55, mean 0.63
- gpt-6.1-sol, reliability-adjusted 0.46, mean 0.59
Next comes gpt-6-sol with 0.43 and gemini-3.8-flash and claude-fable-5 both at 0.42 after reliability adjustment.
The gap between third and fourth place is clear, and the previous top now sits noticeably below the new elite.
Where a higher mean does not translate into higher reliability
The reliability-adjusted score is ms × exp(-2.25 × CoV^0.88). A higher mean can be erased by a higher coefficient of variation CoV, i.e. by more run-to-run instability.
gpt-6-sol vs gpt-5.6-sol is the clearest example. gpt-6-sol has the higher average: mean 0.53 vs 0.48 for gpt-5.6-sol, about +10% on raw analytical quality. After the stability penalty, it ends up behind: reliability-adjusted 0.43 vs 0.46.
gpt-6-sol reaches higher peaks on average but is more volatile across the five repeated trajectories per problem. gpt-5.6-sol is less volatile, so its mean is largely preserved after adjustment. In production terms, gpt-6-sol may occasionally give a better answer, but gpt-5.6-sol is the more dependable choice.
A similar pattern appears at the top of the new cohort. gpt-6-astra has a mean of 0.63 vs 0.65 for claude-opus-5-5, and a reliability-adjusted score of 0.55 vs 0.62. The gap widens after adjustment, indicating higher relative instability for gpt-6-astra despite being second best on average.
In the mid-field, gemini-3.8-flash shows the opposite effect. It has a mean of 0.52 vs 0.50 for claude-fable-5, yet both end up at 0.42 after reliability adjustment. The higher average of gemini-3.8-flash is offset by larger run-to-run variation, bringing it level with the older claude-fable-5.
gpt-6-luna shows a large penalty: mean 0.29 drops to reliability-adjusted 0.18. The wide interval in the mean-score chart signals high variability, so the model’s average is discounted heavily.
Why the mean is not enough
The benchmark again shows that similar means can lead to different adjusted results. Claude-sonnet-5 and gpt-5.4 both have a mean of 0.23 in both measurements, with reliability-adjusted scores of 0.10 and 0.07, respectively. gemini-3.5-flash has a mean of 0.24 and a reliability-adjusted score of 0.10, so after adjustment it matches claude-sonnet-5. gemini-3.1-pro-preview, with a mean of 0.21, falls to 0.07, the same as gpt-5.4. Similarly, deepseek-reasoner, the weakest by mean at 0.18, achieves a reliability-adjusted score of 0.09 thanks to greater stability and outranks models with higher means. This confirms the principle that a model’s usefulness depends not only on average quality but also on the predictability of that quality.
How to read the results
The mean score estimates each model’s average analytical quality across the benchmark. The interval shown in the mean-score chart is ±1 standard deviation calculated from the coefficient of variation. A wider interval indicates greater variation between repeated trajectories. In practice, this means the model may solve a task well in one run and perform much worse in another.
The reliability-adjusted score combines the mean result with relative instability: Reliability-adjusted score = ms × exp(-2.25 × CoV^0.88), where ms is the mean score, and CoV is the coefficient of variation across repeated trajectories. The score is bounded between 0 and 1. Higher values indicate stronger analytical quality and repeatability.
Evaluation setup
The complete EDA Benchmark methodology, public tasks, configuration, outputs, and evaluation artifacts are available in the project repository on GitHub
Custom datasets and evaluation environments
EDA Benchmark is a public example of the synthetic data and evaluation work developed at deepsense.ai.
We create custom datasets, task generators, benchmarks, and evaluation environments for AI labs developing LLMs, VLMs, and agentic systems.
Table of contents